Google Analytics for Beginners: Getting Started with GA4
Get started with Google Analytics 4 (GA4) in this beginner's guide. Learn the basics of setting up, navigating the interface, and leveraging data insights to track and enhance your website performance.

-
What Is Google Analytics?
Google Analytics is a no-fee website analytics tool that helps the marketer understand their site performance much better. While Google Search Console provides data in more detail on how users find websites through Google organic (unpaid) search, Google Analytics deals with all traffic sources: organic search, paid search, social media, and others. Beyond informing you of how your users arrive at your site, it has data that tells you what they do after arrival. That includes which pages they view and what actions they take.
Google Analytics can also seem complicated and confusing at first. But it doesn't have to be. In this guide, we'll teach you the basics of Google Analytics and help you install it on your site. Okay, so let's quickly get through this.
Universal Analytics
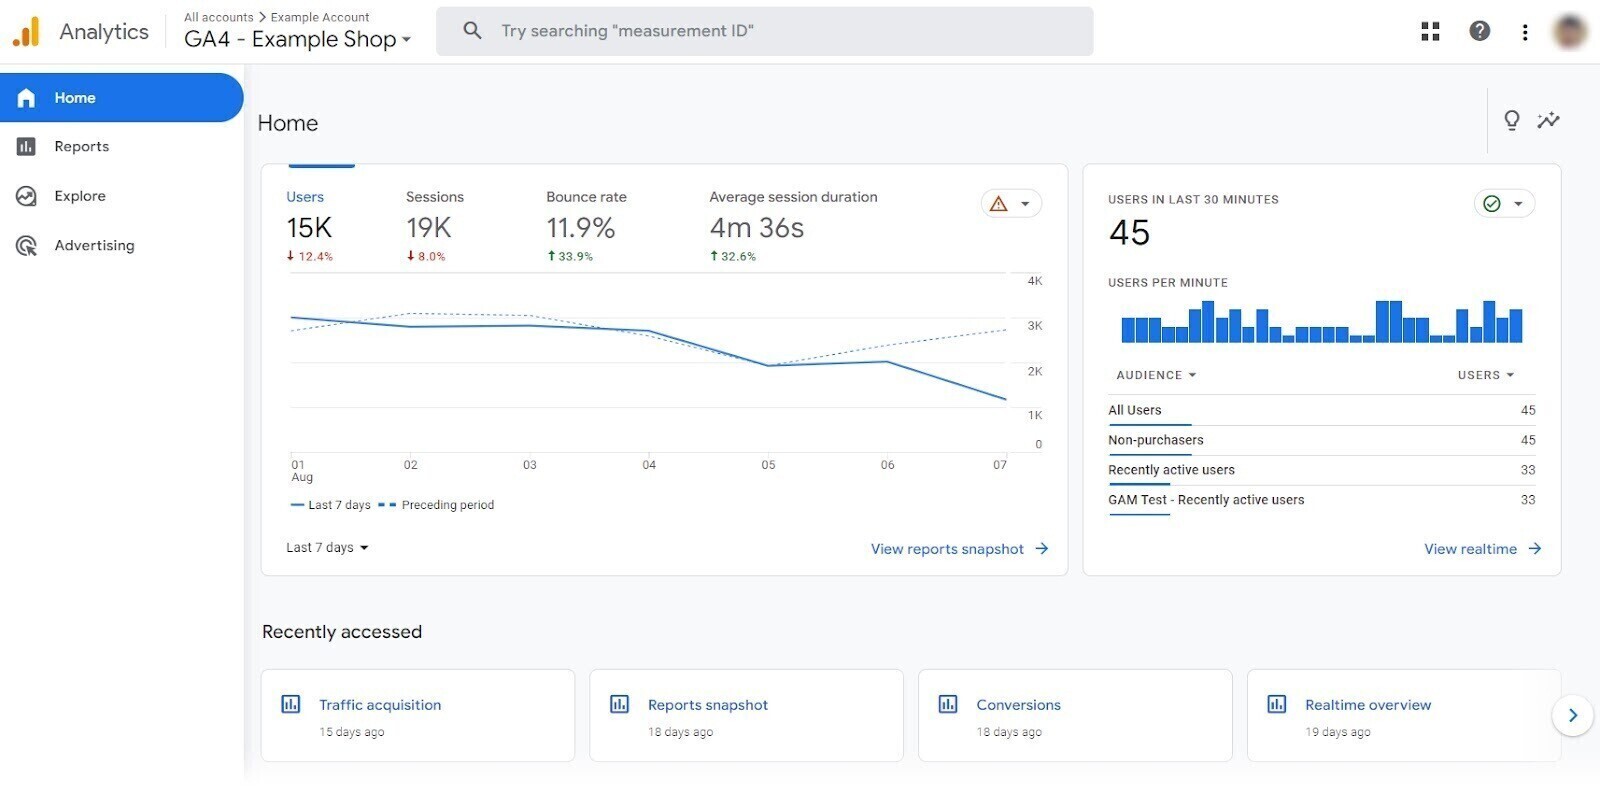
Universal Analytics (UA) is not the current version of Google Analytics. It wasn't even near the first version. But, anyway, the version made Google Analytics a big deal. In 2012, Google released a beta version that almost went viral in digital marketing circles. How viral? According to Statista, the sum of all versions of Google Analytics holds a share of over 70% in the web analytics software market.This is what the dashboard used to look like:
What the dashboard in Universal Analytics looked like
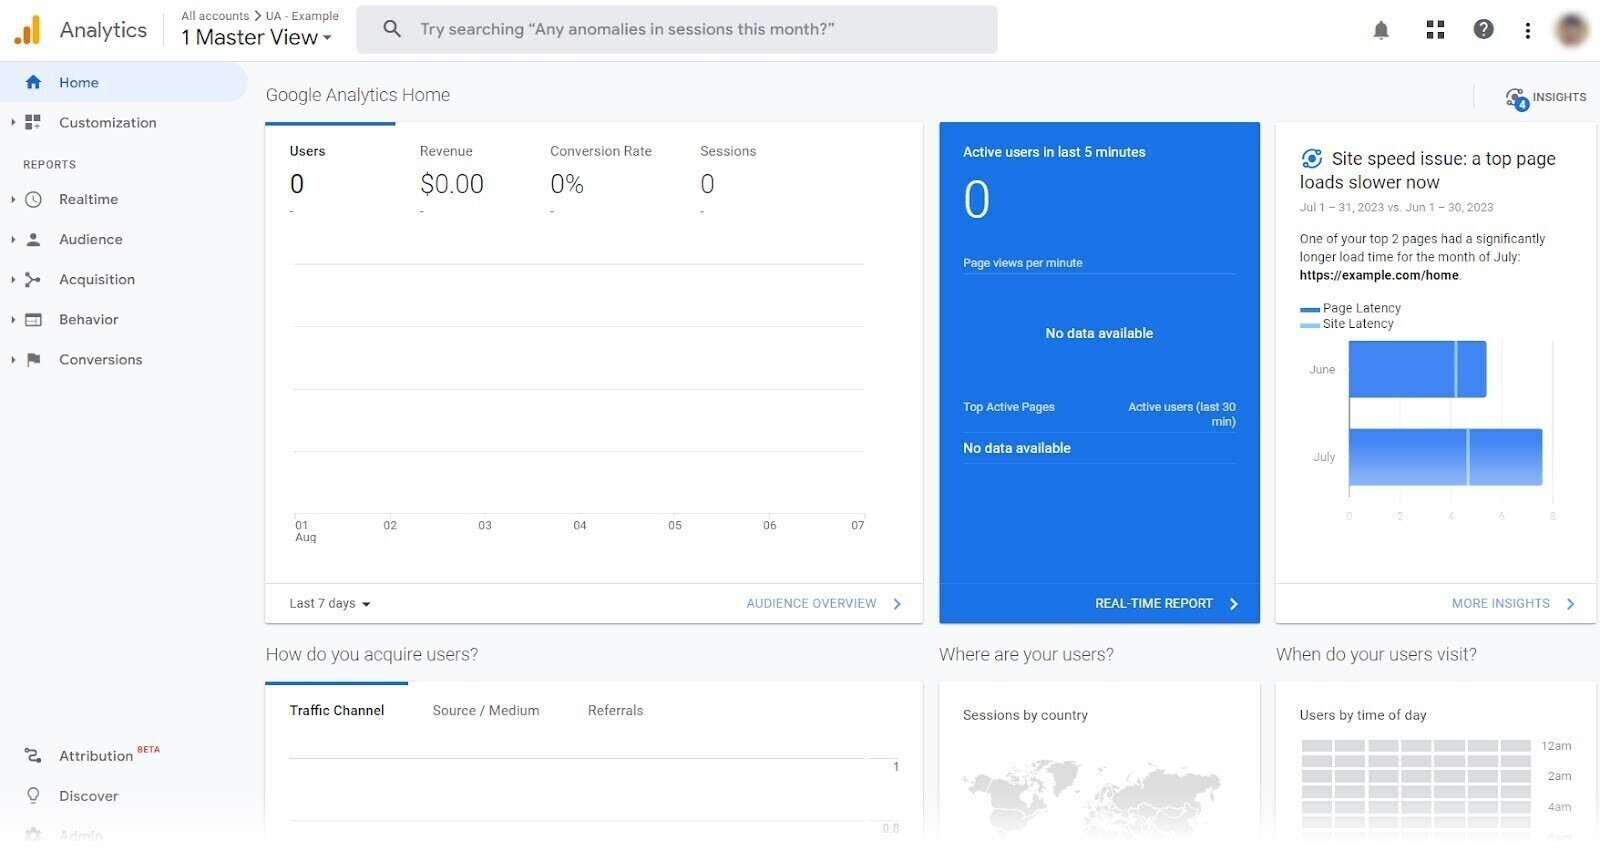
But you won't see it these days.
That's because Universal Analytics was set to stop processing new data in standard accounts on July 1, 2023. So marketers started adjusting to the latest Google Analytics 4.
-
What Is Google Analytics Used For?
Google Analytics helps answer important questions about how your website (or app) is performing. So you can find ways to improve.
Note: We'll discuss only GA4 for the remainder of this article because UA is no longer supported. The platform should help answer the following questions:
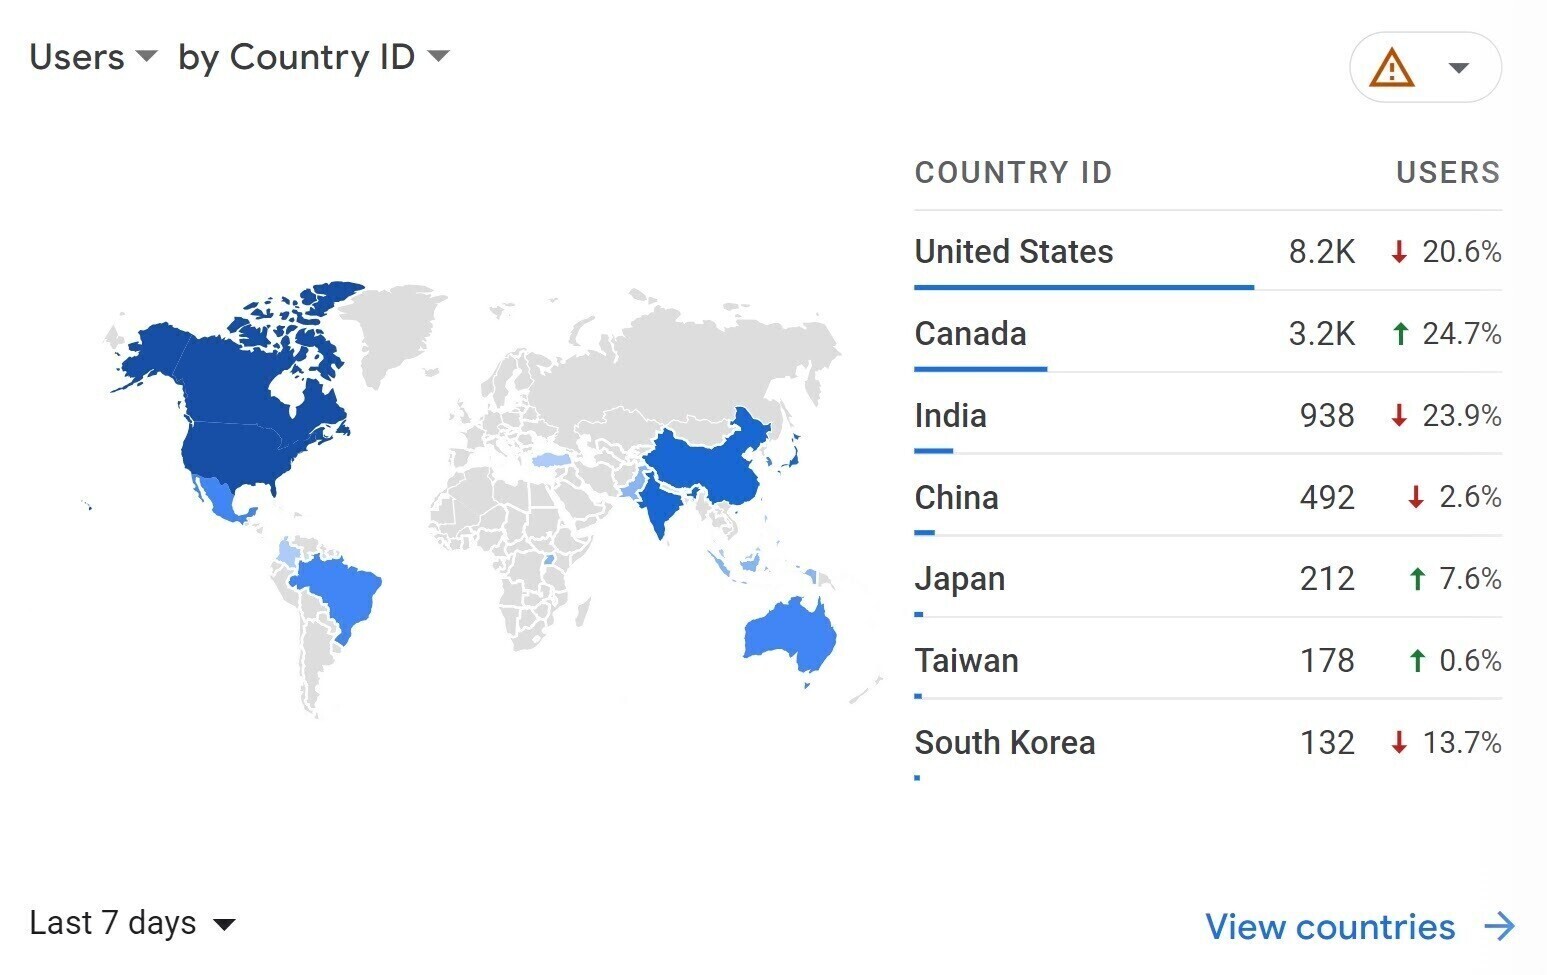
- Who was on your website? You can learn what the interests of your users are, what languages they speak, what cities they live in, and from what countries they come.
- What occurred on your site? You can see how many pages were viewed, how many links have been clicked, how many videos have been played, and much more. Google Analytics will show you how often these interactions take place.
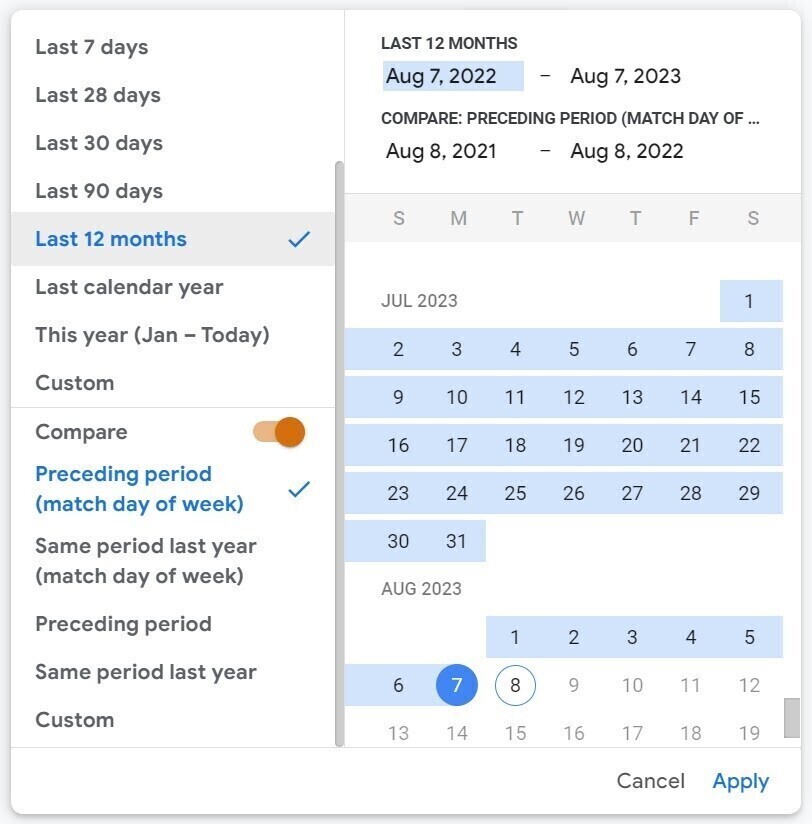
- When did the various events occur? To provide the analysis of relevant time frames, you may change the date range. You can also compare the performance in different timeframes and watch the trend year by year or month by month.
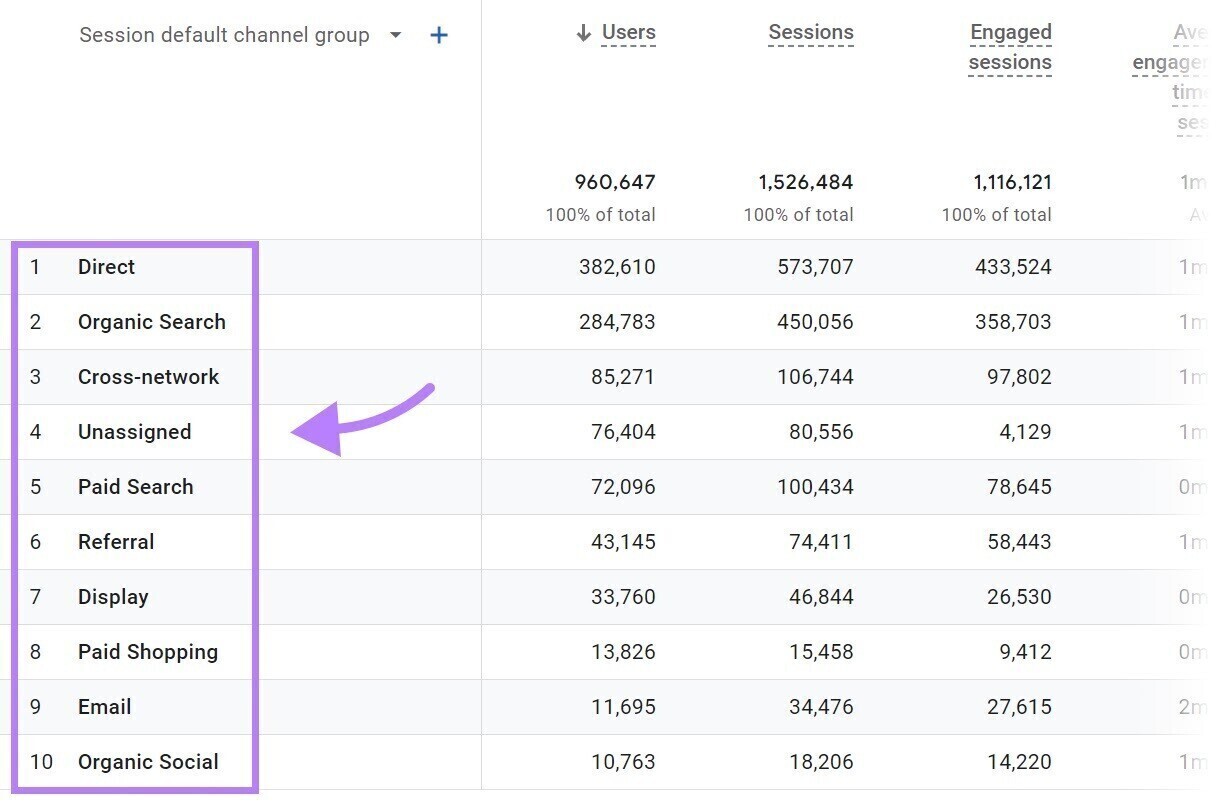
- Where your visitors came from: You will see precisely what contributes most/least traffic to your website. Let's check the report for the "Acquisition Overview" next. Look over to the table on the far right, and see that the vast majority of the traffic comes from organic search: in other words, unpaid traffic from search engines. Organic social and email contribute a tiny percentage of that traffic.
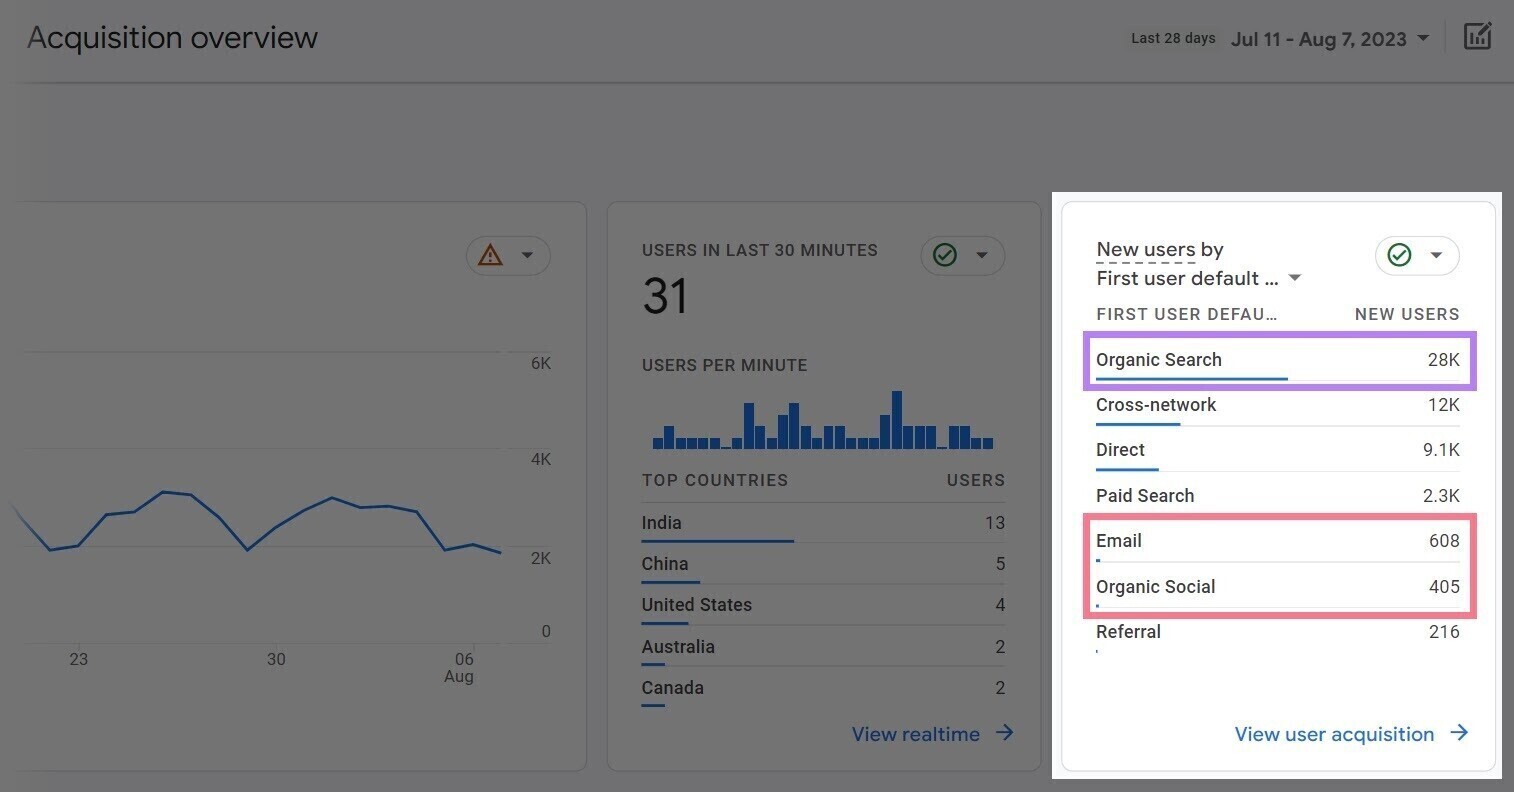
Pro tip: An organization with a traffic profile like this might choose to prioritize its keyword research to continue strengthening its organic search performance.
After answering these questions, you will know what works and what doesn't. And you can use this information to keep improving your results over time.
- Who was on your website? You can learn what the interests of your users are, what languages they speak, what cities they live in, and from what countries they come.
-
How Does Google Analytics Work?
Google Analytics works by collecting data from your website and then creating reports for you to analyze your data.
A tracking code needs to be installed on the site for it to work, which could be as simple as:
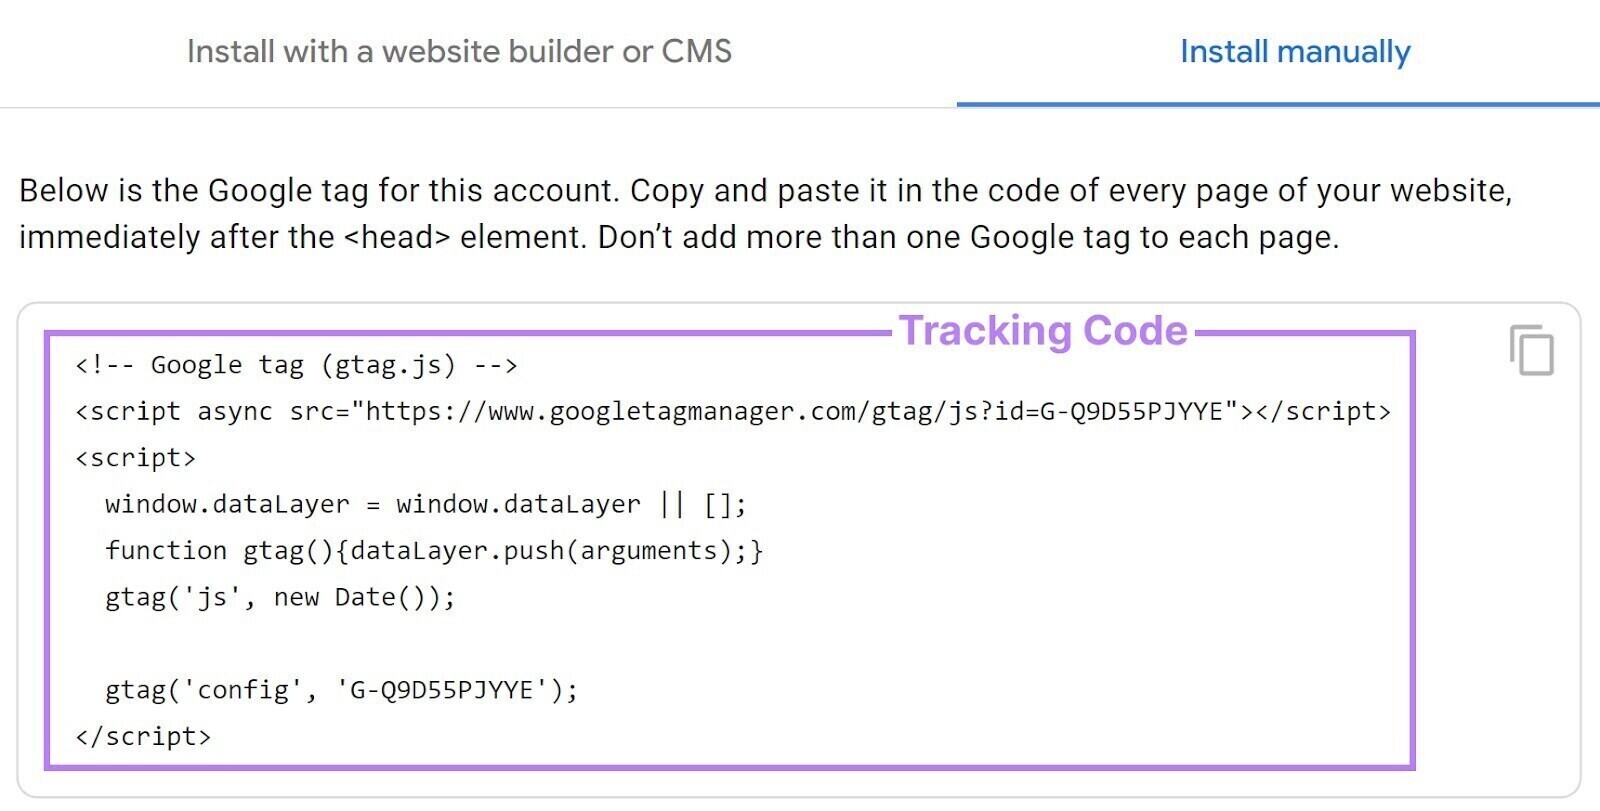
When a user arrives at a site with this tracking code, Google Analytics will deploy a cookie in the person's web browser. This cookie will contain data about the visitor's session. These details of visitor activity will be that which is located within your Google Analytics reports.
How does this data look?
Let's see several moves from right to left. Similar to that shown below.
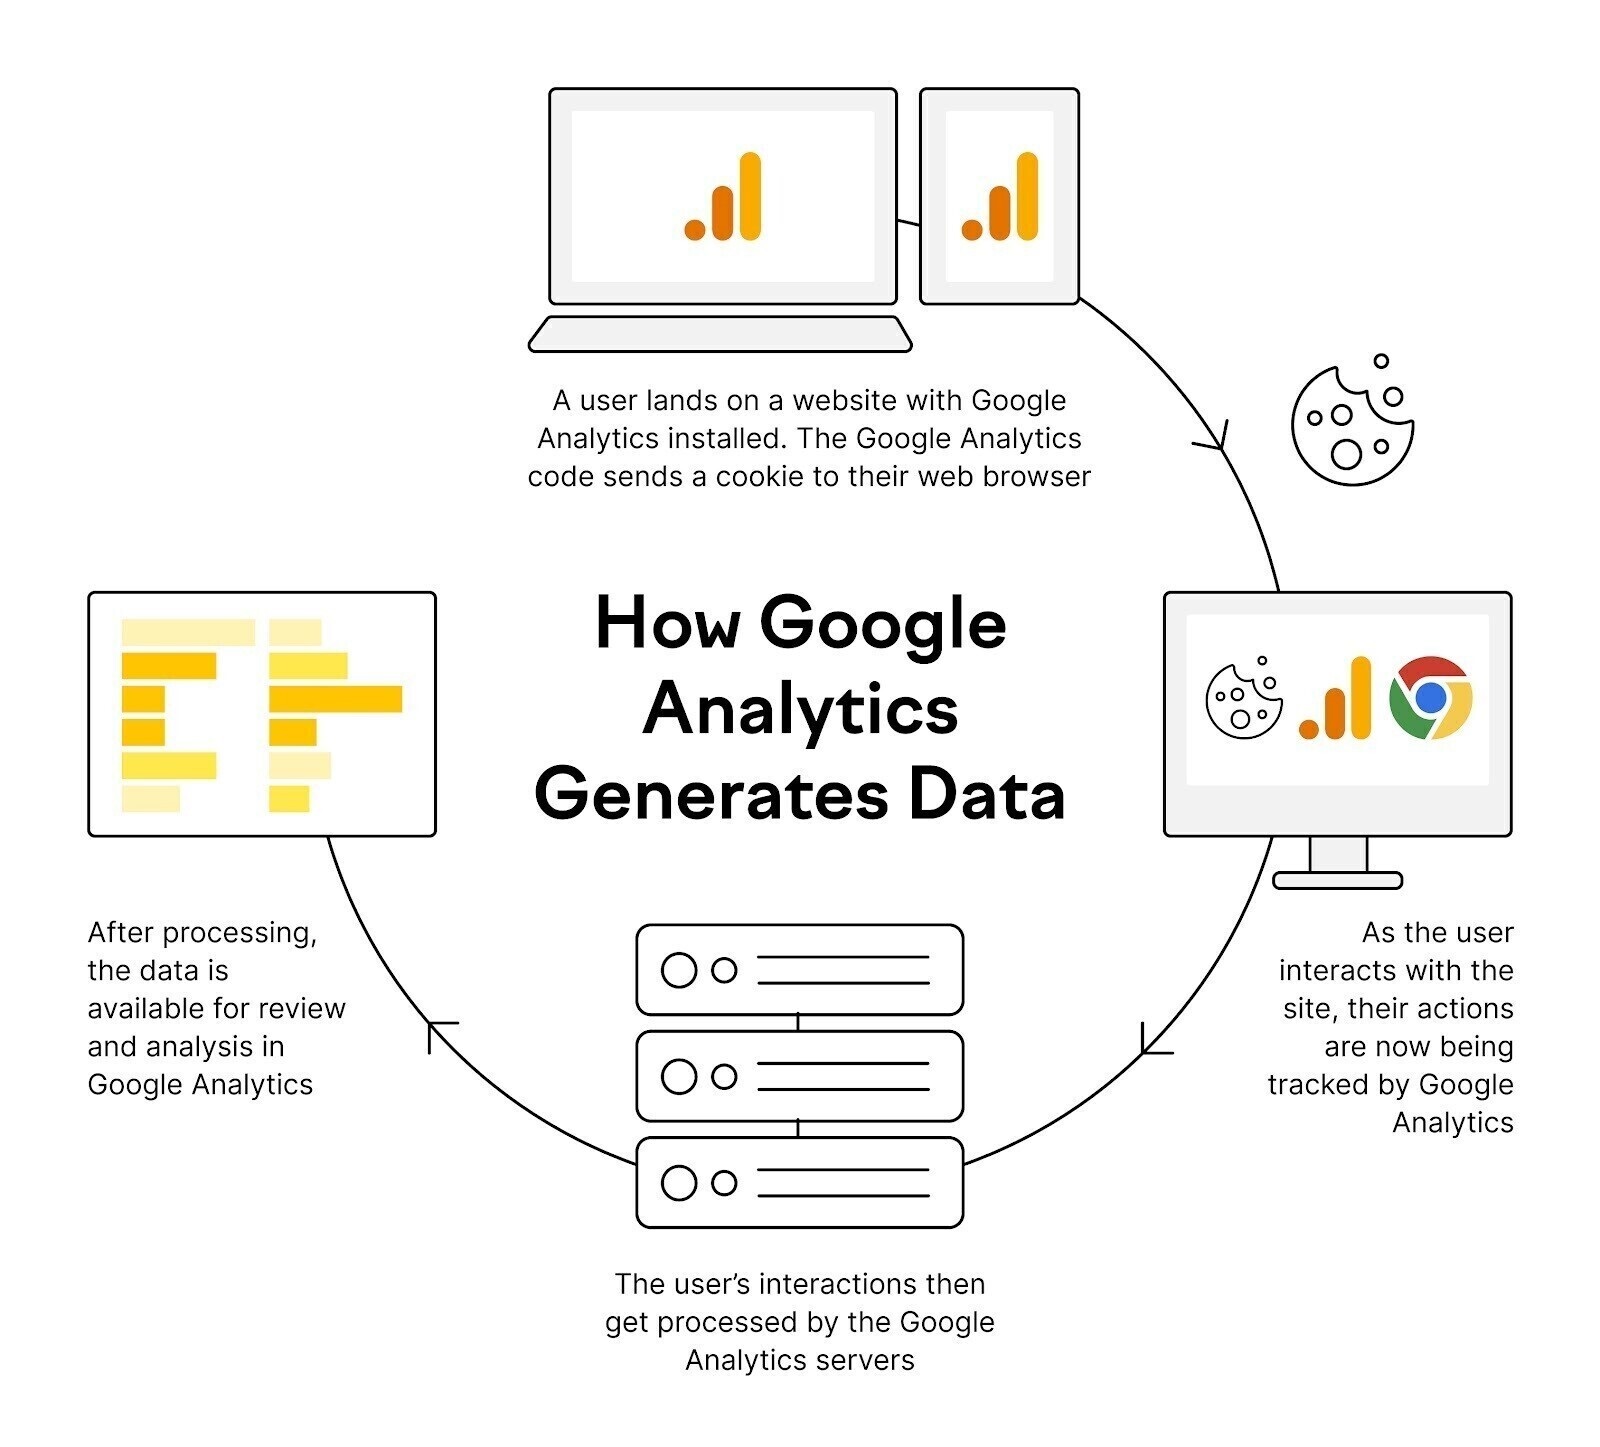
Step 1: A user visits a Google Analytics website. The Google Analytics code sends a cookie to that user's web browser.
Step 2: From now on, every single action of this user on the website will be tracked by Google Analytics.
Step 3: The actions of the user are processed on Google Analytics servers.
Step 4: Information from that processing is available for review and analysis in Google Analytics.
Now, let's set up Google Analytics on your website.
-
How to Set up Google Analytics
To set up Google Analytics, this is a two-step process.
Step number one is that you need to create a Google Analytics 4 property. This will produce your unique tracking code.
Step number two is that you have to install that tracking code on your website.
Let's dive into this Google Analytics how-to and set up your account.
Create a Google Analytics Account
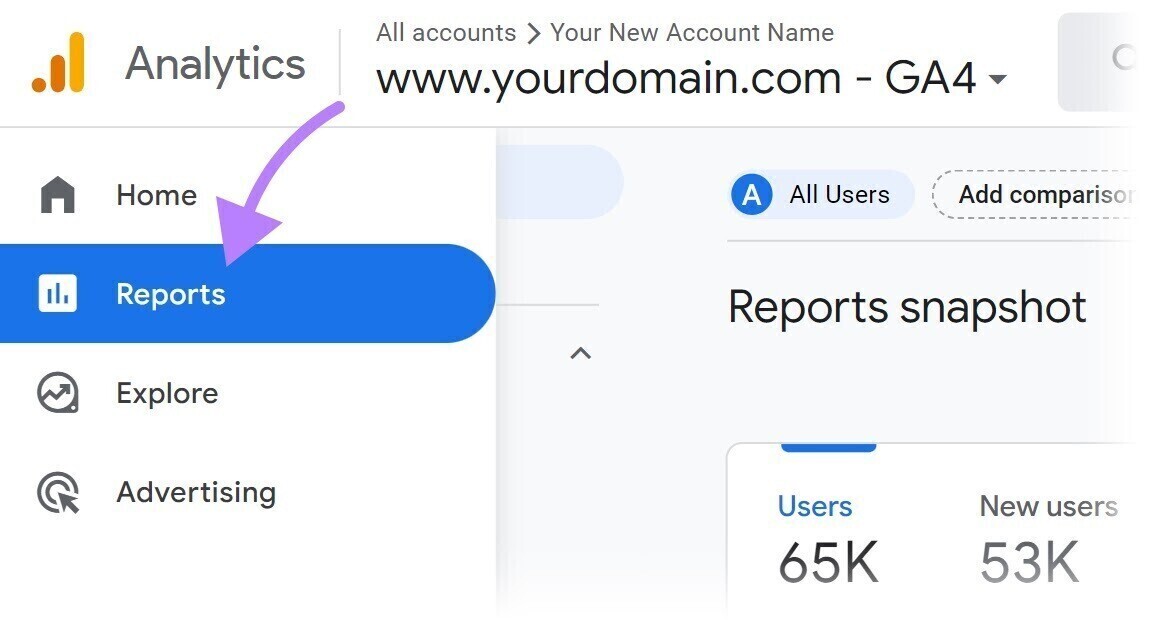
First, log in to Google Analytics with your Google account.
If you've never had a Google Analytics account before, this is the screen you're going to see.
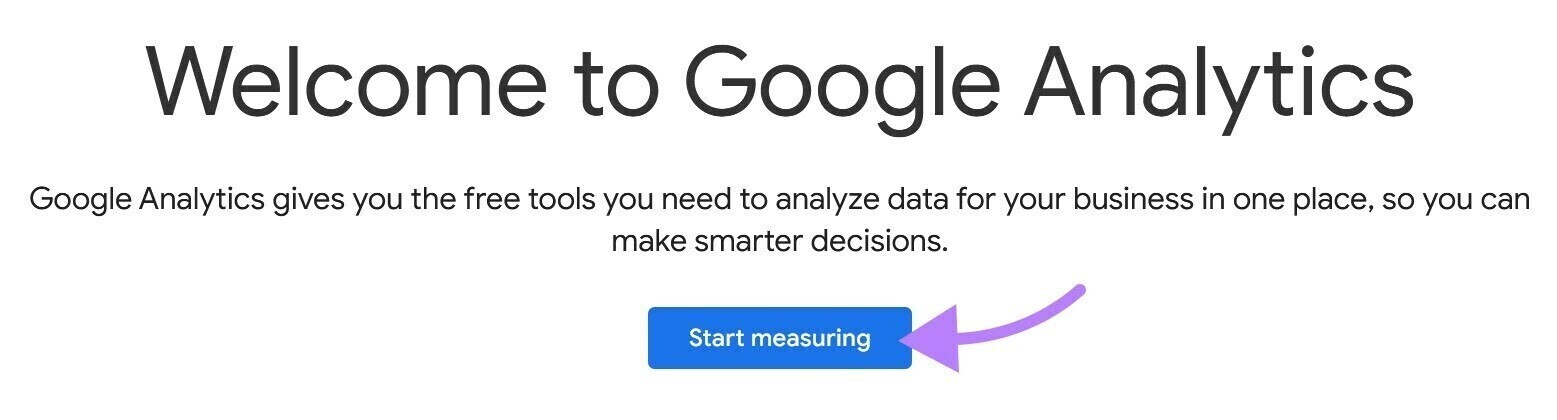
Click on "Start measuring" and move on down to Step 1 below.
If you have used Google Analytics before (with the email address you've used to log in), you won't get this welcome screen. If that is your situation, click on the gear in the bottom left of your screen to access the admin area.
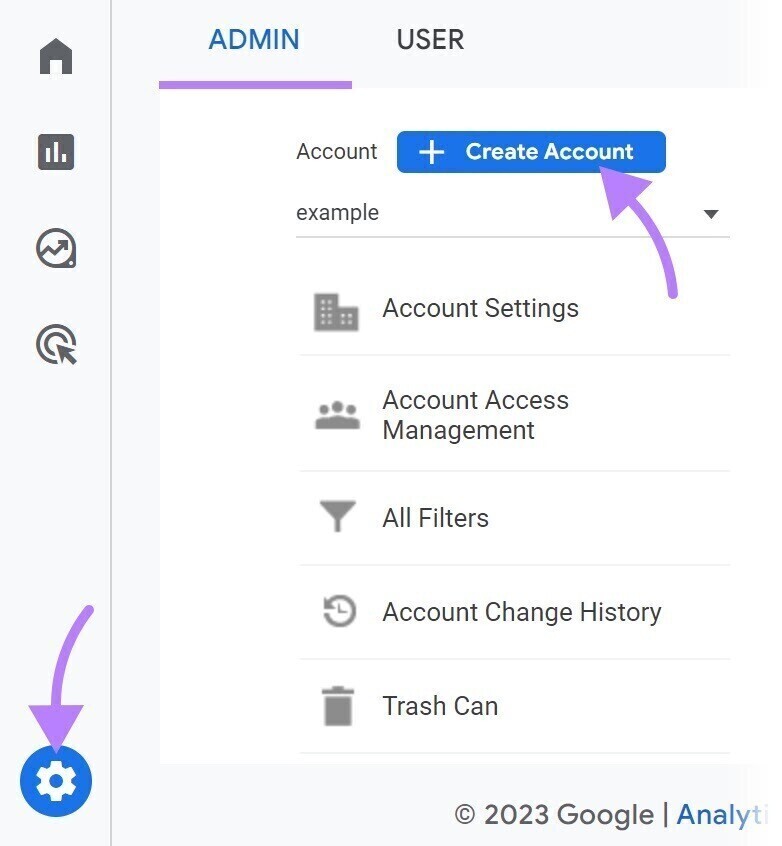
Then click "Create Account" and follow through Step 1 below.
1. Set up Your Account
First, you will name the account.
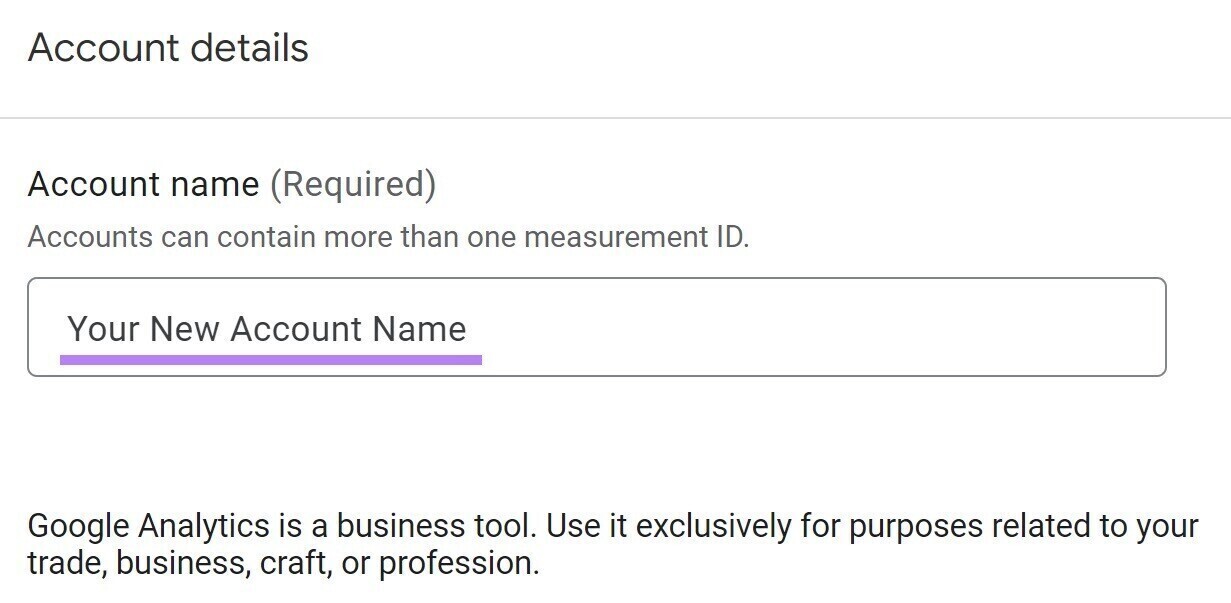
You can pick whatever name you want; however, use your business name.
Google will give you the option of what type of information to share with Google in this step. Like "Technical support" (who could assist with a technical problem in the future) and "Account specialists" (who could call you in the future to sell services).
Then click "Next"
2. Create Your GA4 Property
Now, name your property.
Note: Remember the property level is where the data lives in Google Analytics. If you have more than one website, then you can have more than one property all inside of a single account.
Once again, you can name anything you like. It doesn't hurt to probably name it after the domain of the website you're going to track, in addition to that, you can choose your reporting time zone and your currency.
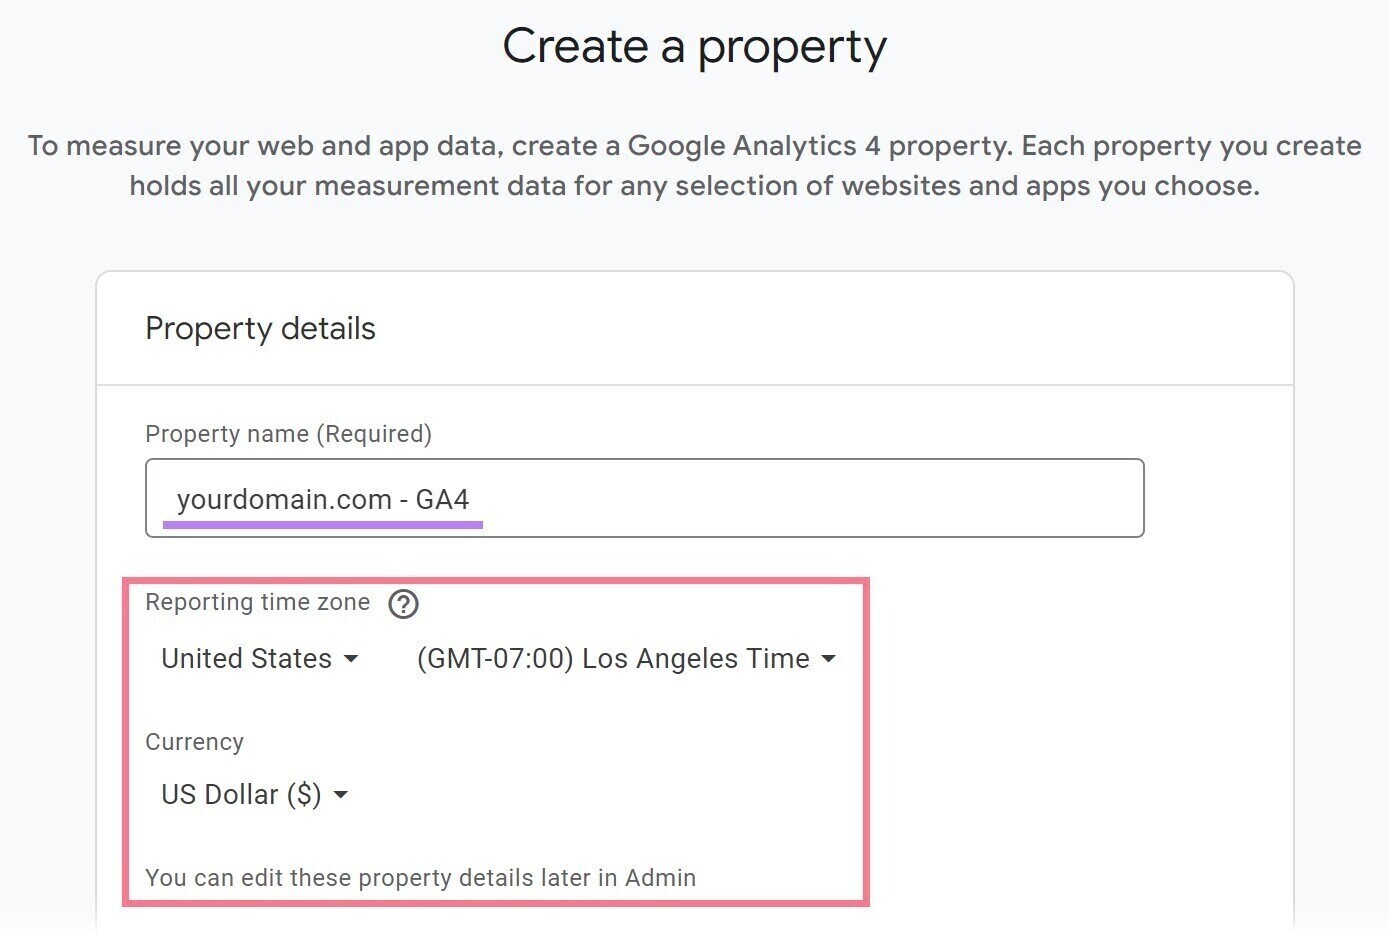
After you've made your choices, you click "Next."
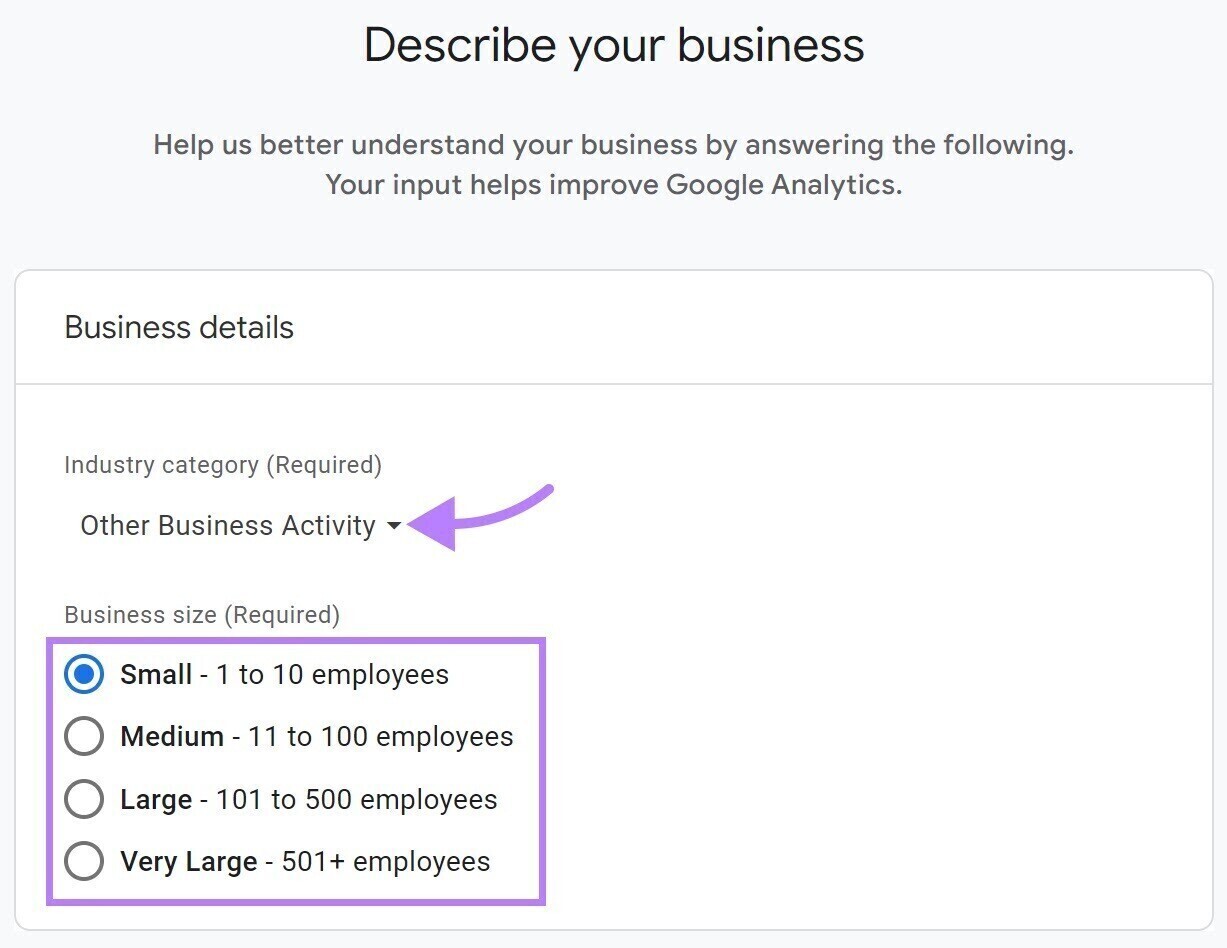
3. Provide Your Business Information
Now, choose the industry category you think is closest to yours in the drop-down. If nothing matches, you can pick "Other Business Activity".
And then select your business size.
Click "Next."
4. Select Your Business Objective and Accept Terms of Service
The choice you make here pre-loads the reports in your Google Analytics property.
That's all right; you can simply click "Get baseline reports" and add more later if needed.
Then click "Create".
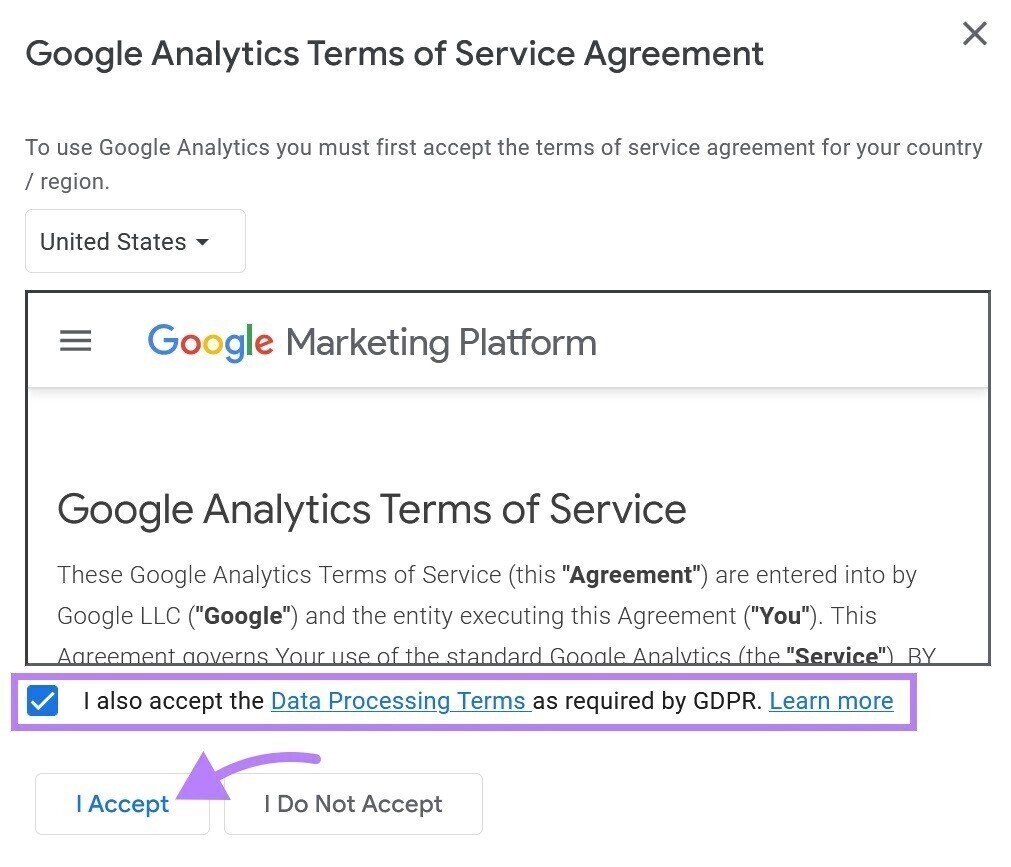
So now you'll need to agree to the terms of service for Google Analytics.
Review and choose "I Accept" for the data processing terms.
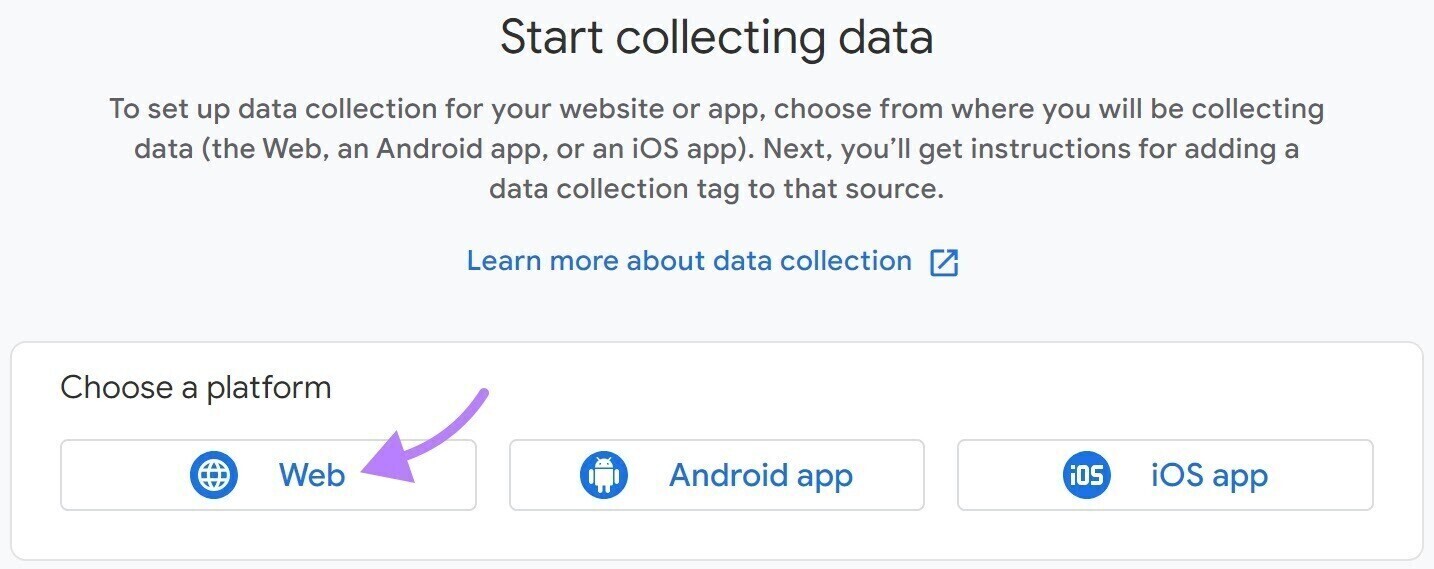
5. Setting Your Data Stream:
You can now collect data so that you can set up your data stream. This data stream will send data to your Google Analytics property. Select the type of platform you are working on.
Choose the Web if you are working on a website.
You can now configure your web data stream, and you should see the section looking like this:
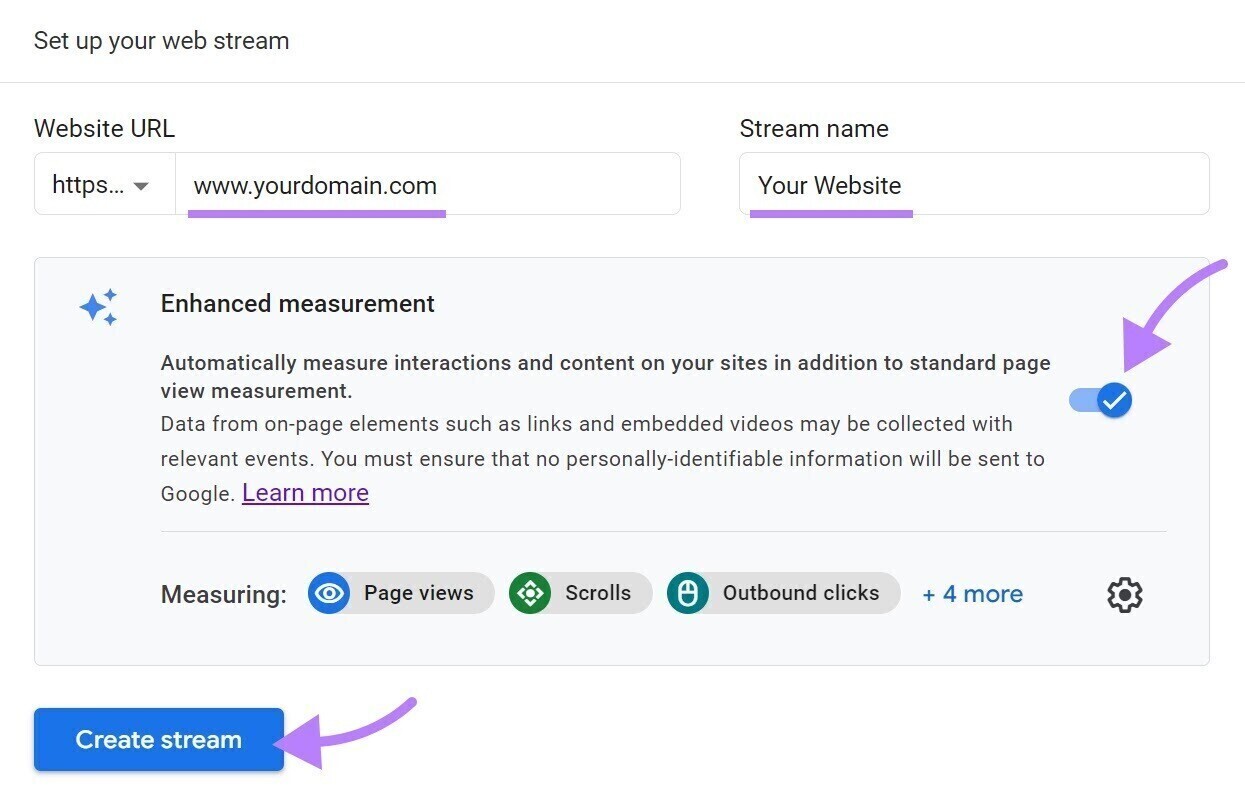
There are three things to do here:
- Enter your website URL.
- Give your data stream a name. You can name it whatever you want. If your domain was www.templatecorp.com, maybe you choose Stream Name: Template Corp Website.
- Make sure the blue toggle bar is switched on for "Enhanced measurement"—this enables you to track the number of essential interactions like file downloads, external link clicks, and embedded video plays without doing any custom work.
With all that is done, it's time to implement the tracking code to put your data stream in a position to start data flow to GA4.
Install Google Analytics
You can install Google Analytics on your website. Once you have finished with the configuration of your stream within GA4, you will be taken to the following screen, which has a "MEASUREMENT ID" field unique to your property and a "View tag instructions" button.
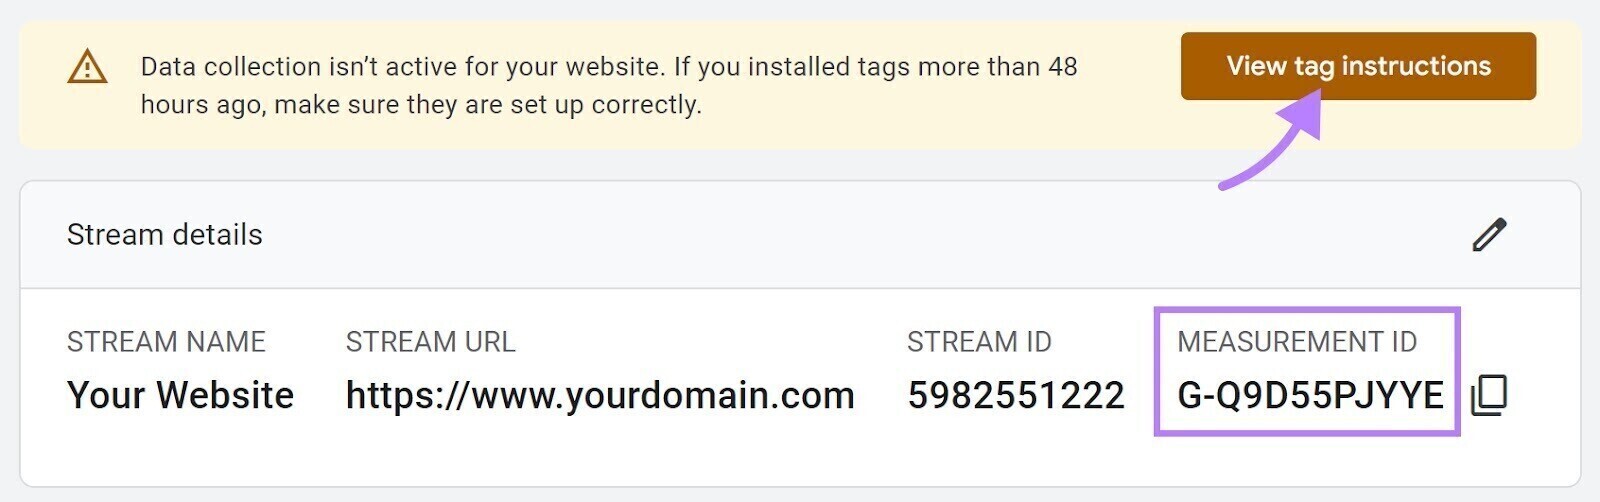
Once you click the button, you'll be given three installation options:
- You can install the code manually on your website.
- You can install the code via a plugin or integration, where applicable.
- You can use Google Tag Manager to install the code.
Pro tip: If you've already got Google Tag Manager running on your site, the third option will likely be the easiest. You can follow the installation instructions in this Google Tag Manager guide. We'll choose a manual.
How to Install GA4 Manually:
To start the installation from your data stream, click the "View tag instructions" button.
Now click on the linked header text that says "Install manually". This is the tracking code that's going to fire GA4.
Click the "copy" icon to copy it to your clipboard.
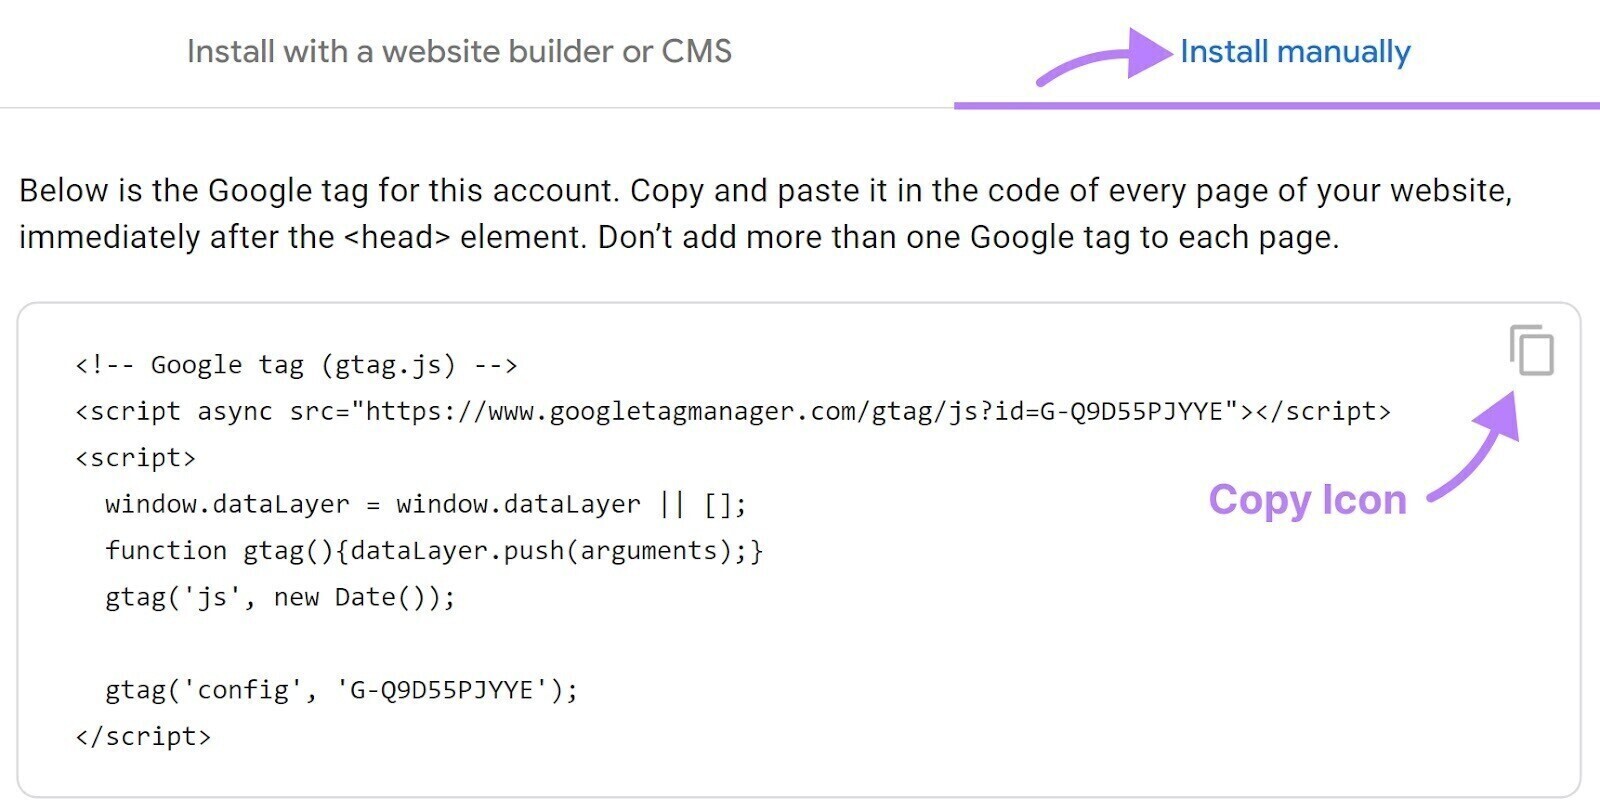
Now, go to your website and paste the code high in the < head > section of the page. By putting the tag at the top of the < head> section, it is timed to fire correctly, and you get more accurate data.
Note: If you're not comfortable editing your website code, reach out to a developer. Some WordPress plugins will allow you to do this without editing template files directly.
Congratulations, your Google Analytics 4 is now up and running on your website!
-
Google Analytics Basics
Data streams into your Google Analytics property.
From where, you wonder?
Google Analytics data is the information about visitors and their interactions on your website.
Here are the top categories:
- Users
- Views
- Sessions
- Events
- Conversions.
See how it all works below.
Users
A user is an individual who comes to your website.
Google Analytics uses cookies to help track the number of these unique individuals who visit your site. As a point of illustration, see the data table below.
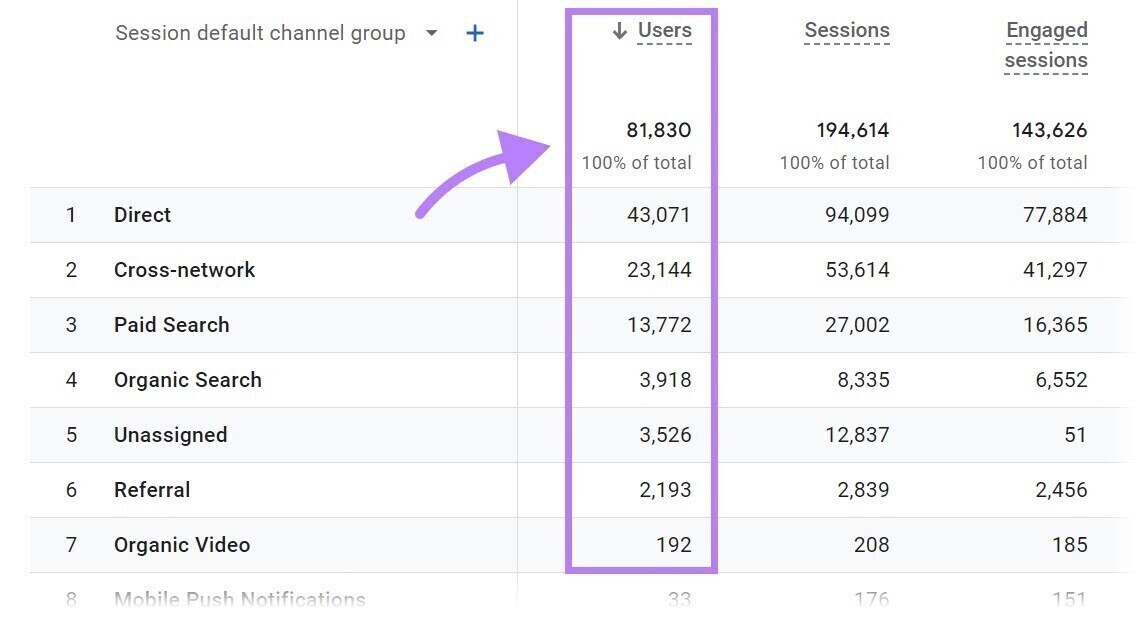
A data table in Google Analytics with the "users" column highlighted. You are doing a bit more when you use Google Analytics than just counting users. You can analyze the behavior of those users. For example, what exact page do they view?
Page views
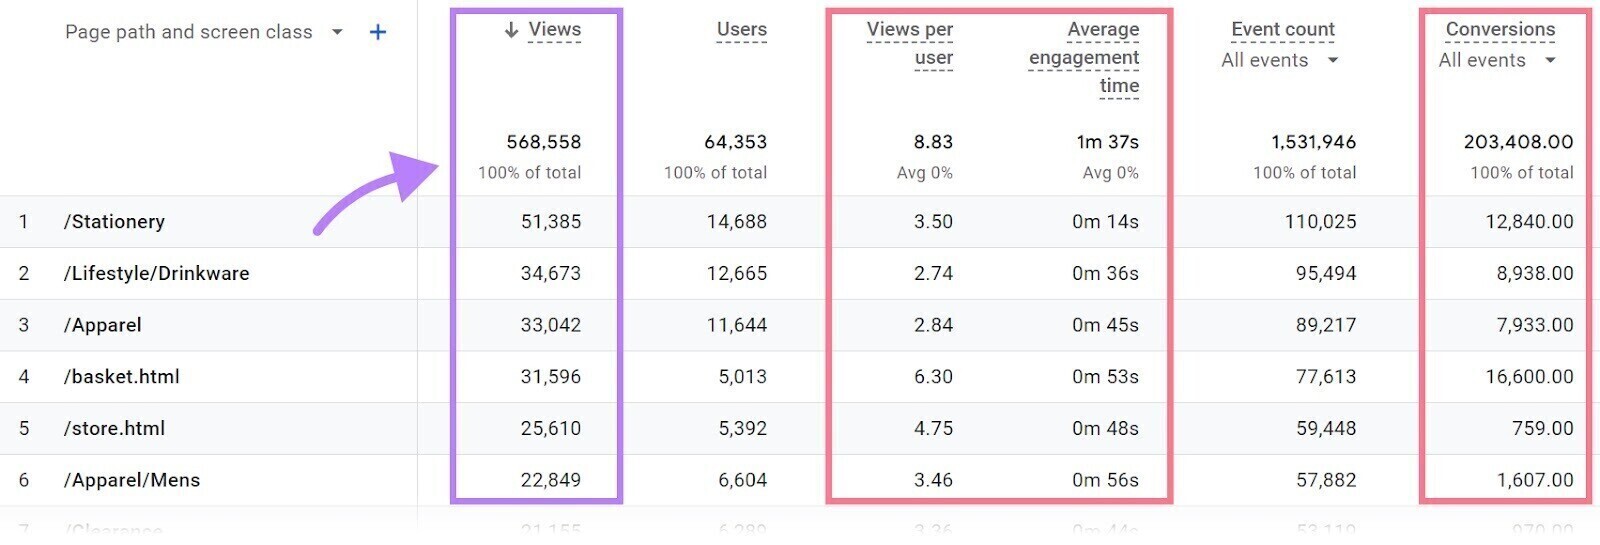
Google Analytics records a view each time a user views a page on your site.
If a user views a page, leaves the site, and then returns to that page in a few minutes, that counts as two views.
Here is a sample data table which has a list of top pages by views. Google Analytics data table: similar to a webpage, but pulled from Google Analytics.
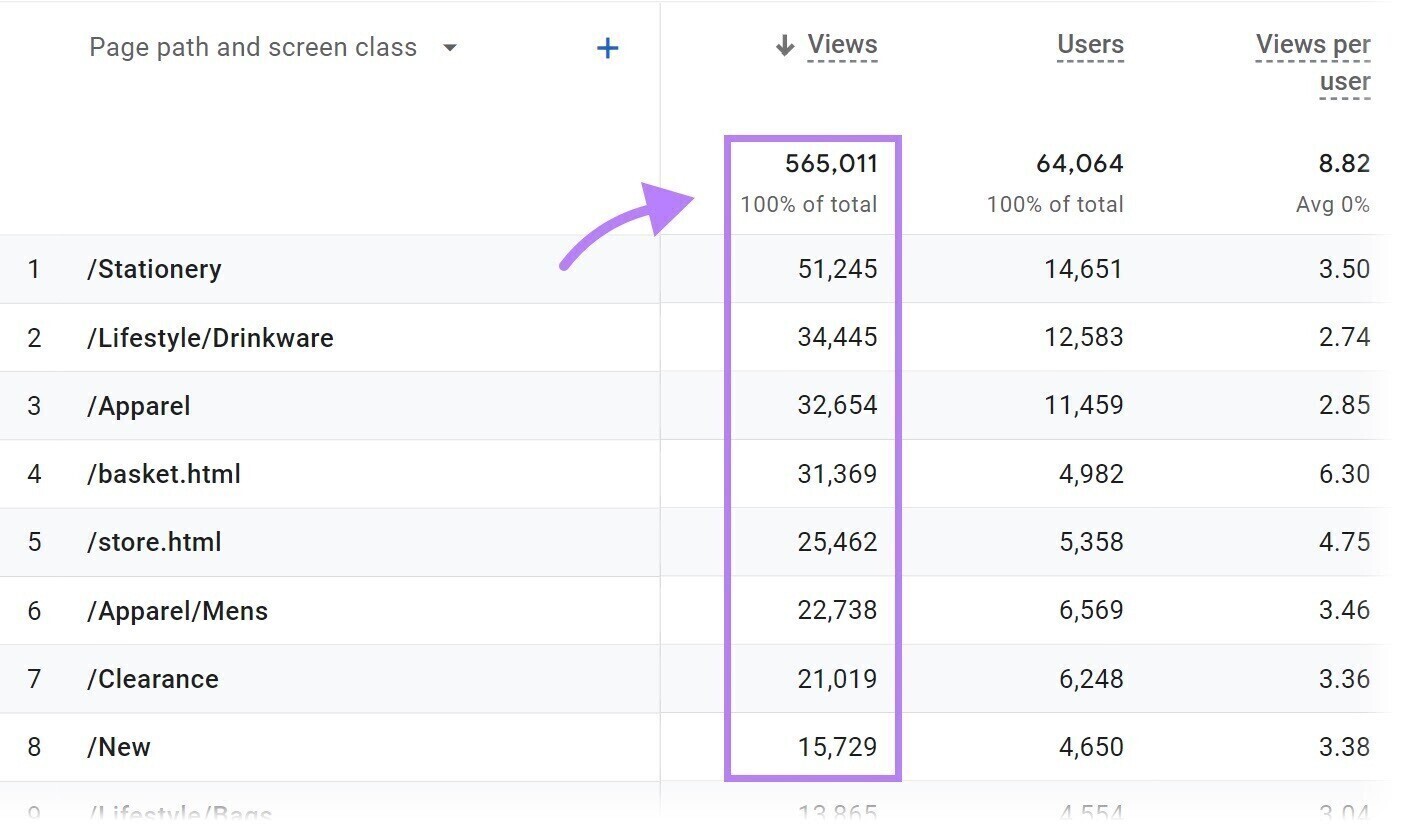
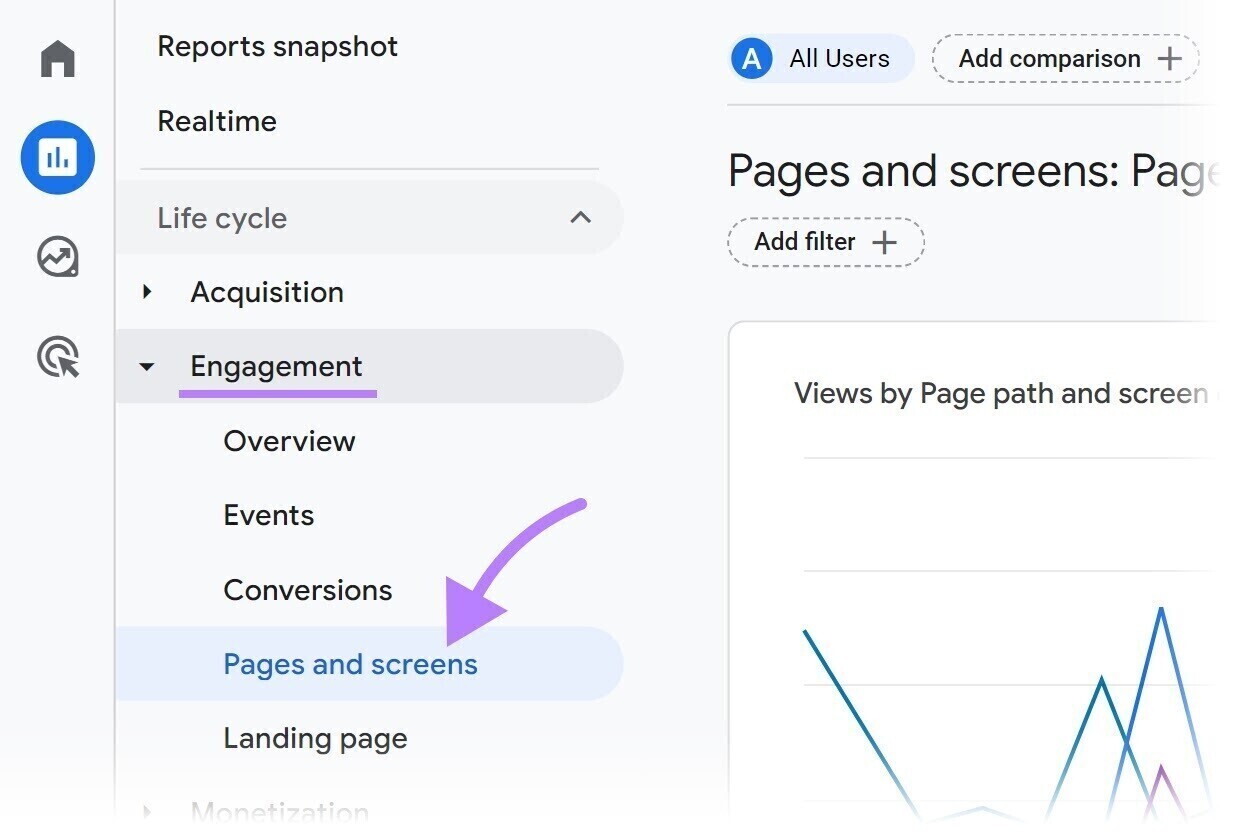
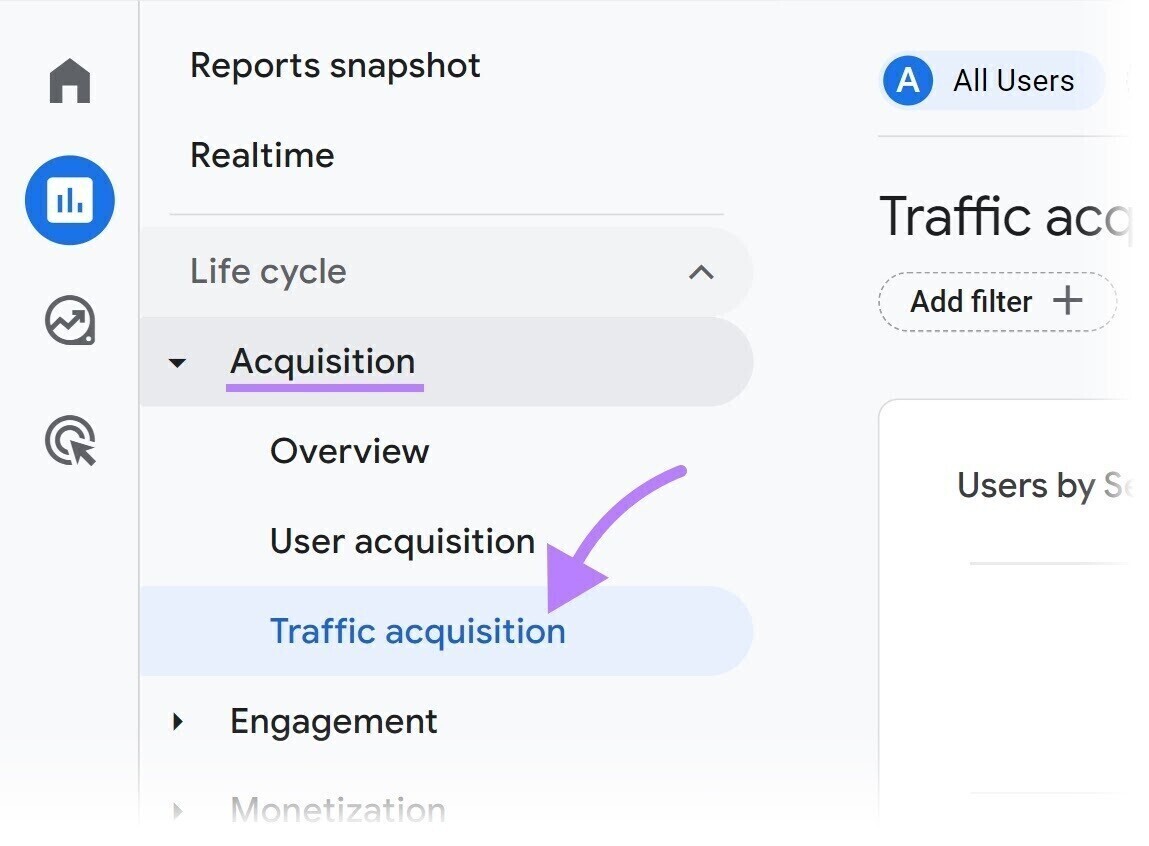
Pro tip: you can quickly access this same report in your own GA4 property. Simply click 'Reports' in the left-hand navigation, then choose 'Pages and screens' within the reporting area called 'Engagement'.
Sessions
A session is when a user visits—not just views—your website. You may have one or multiple sessions on your website.
During a session, many things might happen: like viewing a page, downloading a file, playing a video, clicking a link, or completing a form.
In each case, Google Analytics attributes the interaction to a different session identifier. This way, you know which interactions happened within a session.
A session ends when the visitor exits your site or after 30 minutes of inactivity.
Here is an example partial data table from a Google Analytics property that had 27,053 sessions during the selected date range.
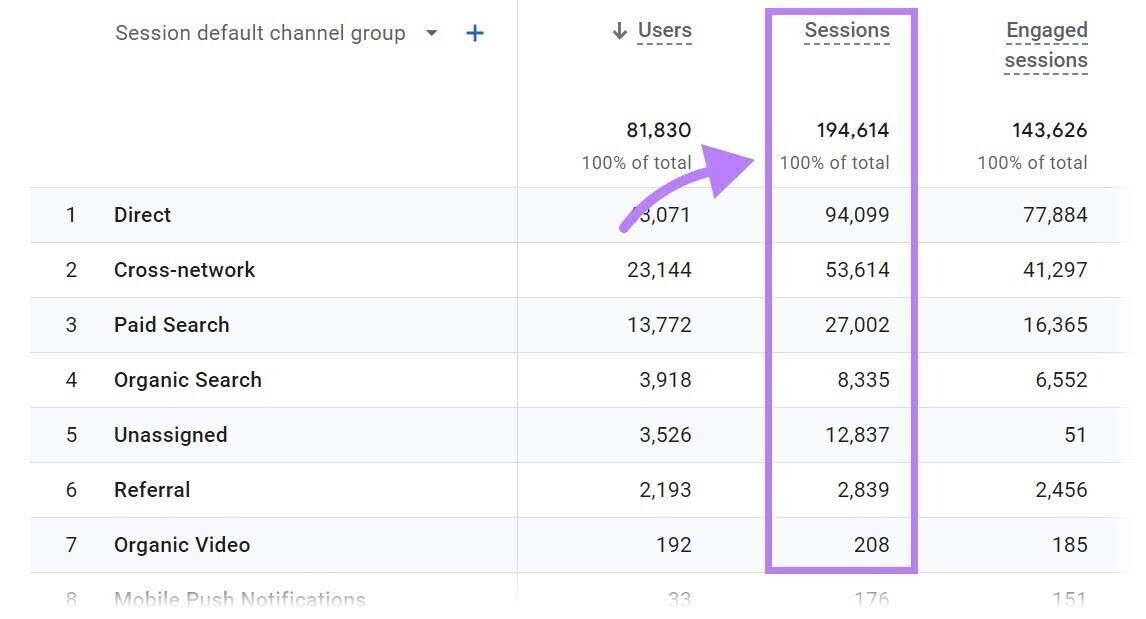
Note: The count of sessions should never be lower than the count of users. That's because you can't have a session without a user.
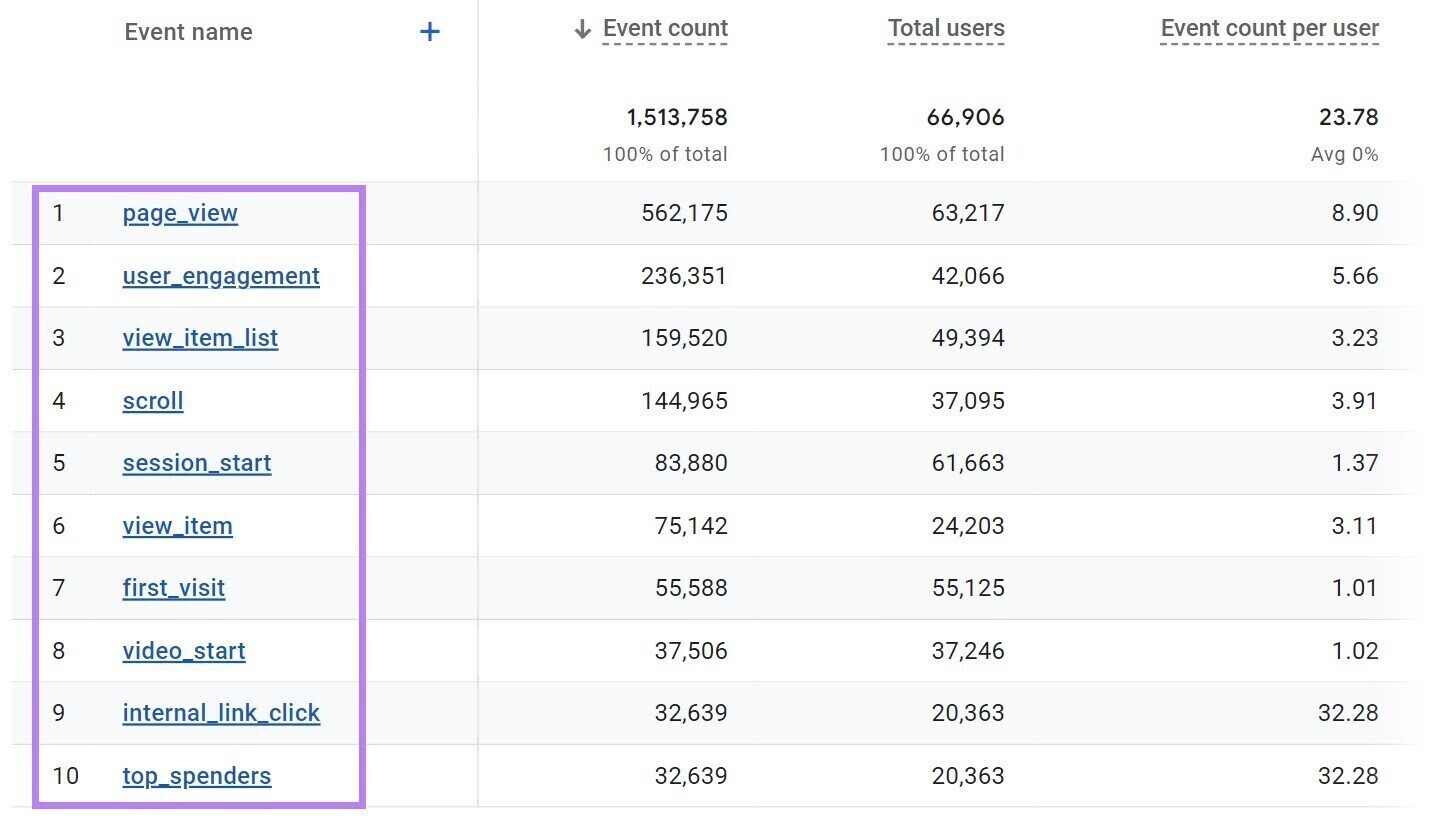
Events
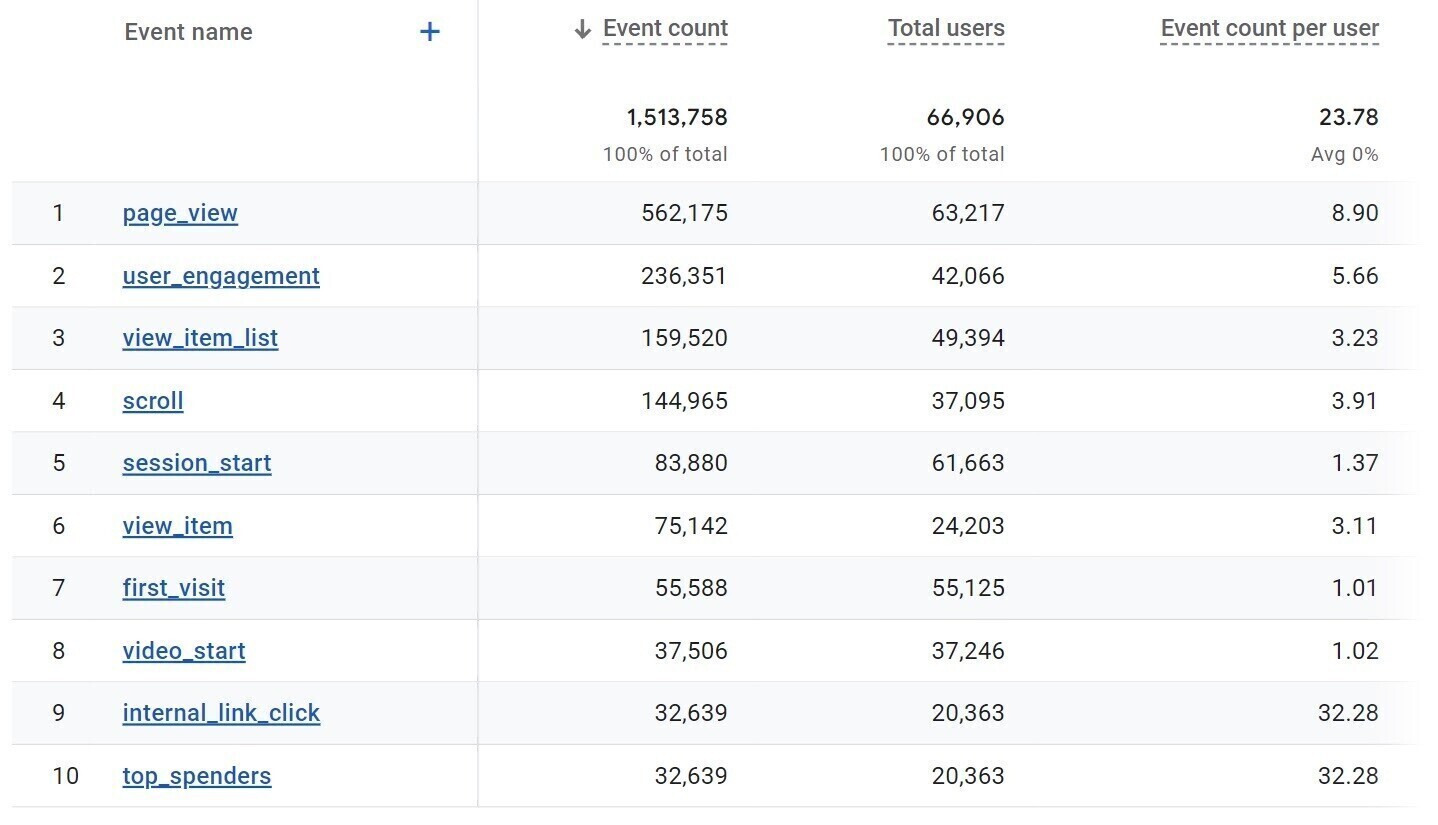
During a session, the user interacts with your site in various ways. They might be downloading a file, playing a video, scrolling on the page, clicking a link, or completing a form. The thing he does is referred to as an event.
For example, Google Analytics can track events like scrolls, session starts, clicks, etc. Like in this image: a data table in Google Analytics with the "event name" column highlighted.
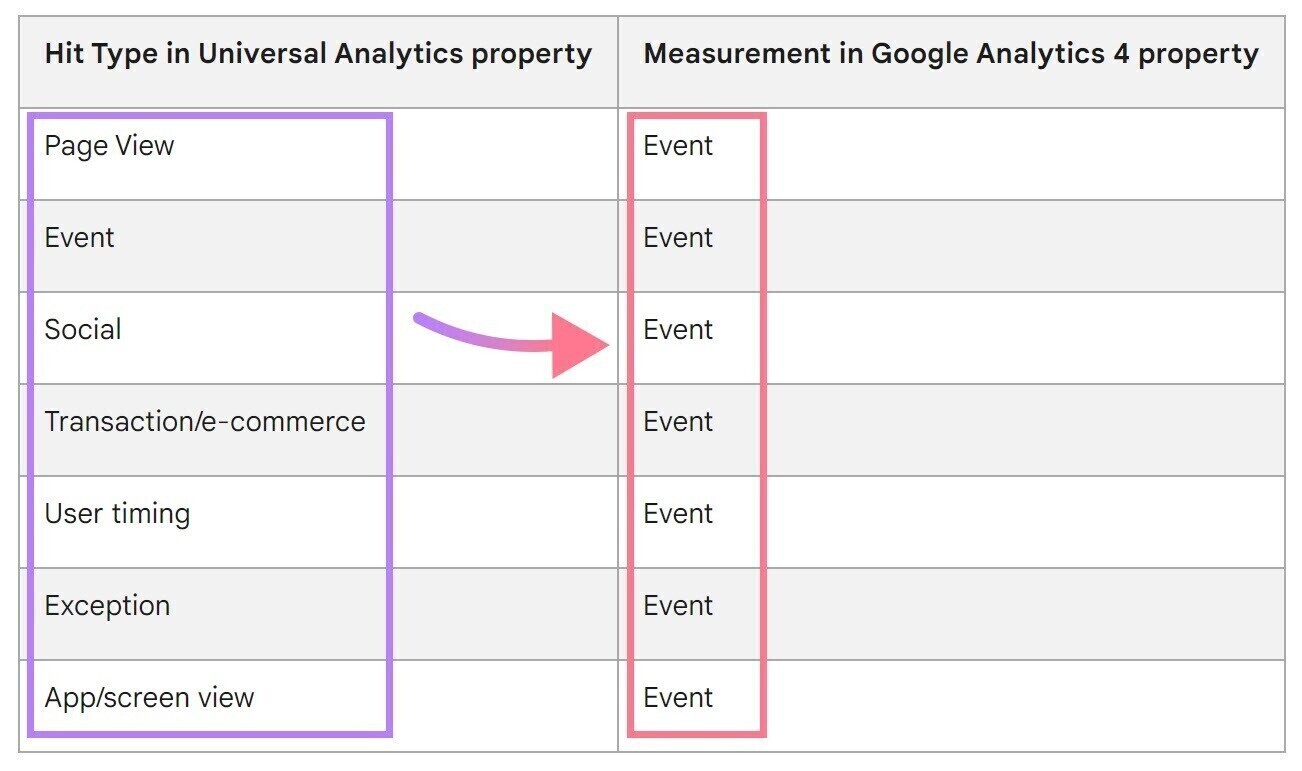
When it comes to events, there are four basics to understand:
- All website interactions are tracked as events. But there are different kinds of events, and they’re treated differently.
- Google Analytics will track some events by default. Some of those cannot be turned off. These are known as "automatically collected events".
- Assuming that during the setup phase, you left the toggle for "Enhanced measurement" turned on, you are also tracking enhanced measurement events by default. You can turn some of these off whenever you want in case they are not a fit for your measurement needs. Here's a link to Google's resource if you want to learn more.
- Also, you can directly track some events within your setup work. For some of these events, Google will give you a proposed name to stick to. Google refers to these as "recommended events." All the rest of the events you make are referred to as "custom events." They are similar to each other in that you must do all the work to create them, Note: Some custom events can be configured directly within the Google Analytics interface, but sometimes custom events will necessitate the use of Google Tag Manager. Just one of the many beautiful things about using Google Tag Manager in conjunction with Google Analytics.
Conversions
Conversions are the most critical type of user interaction on your website.
If you're an eCommerce website, that likely means a sale. For example, when you run a lead generation website, the most critical action could be submitting a contact form.
You will, however, want to identify which specific events should be counted as conversions you would like to monitor. This is very quickly done in GA4 from events that you already track. It means you would like to do this going forward once your GA4 property has specific events recorded.
You can even generate that event data yourself by clicking on your site. For example, assume you wanted to measure the file download event (file_download) as a conversion. With enhanced measurement, this would be calculated automatically.
Here's how.
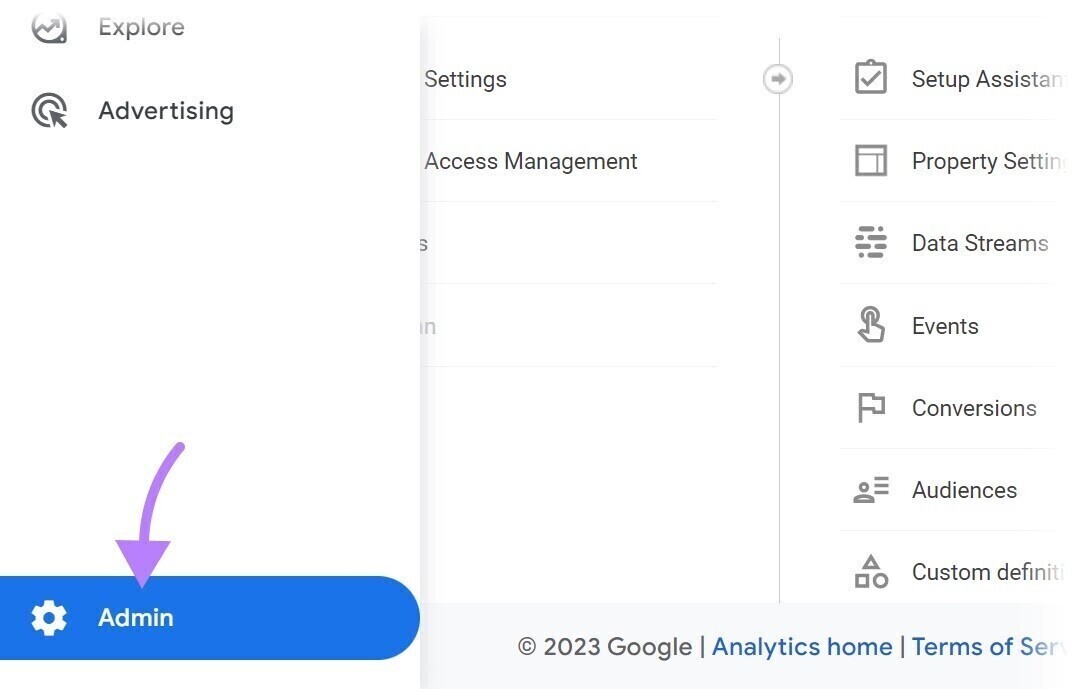
Click "Admin" in the bottom left of the Google Analytics interface ("Admin" button in the lower left of the Google Analytics interface).
In the middle of the screen, under the property settings, click on "Events".
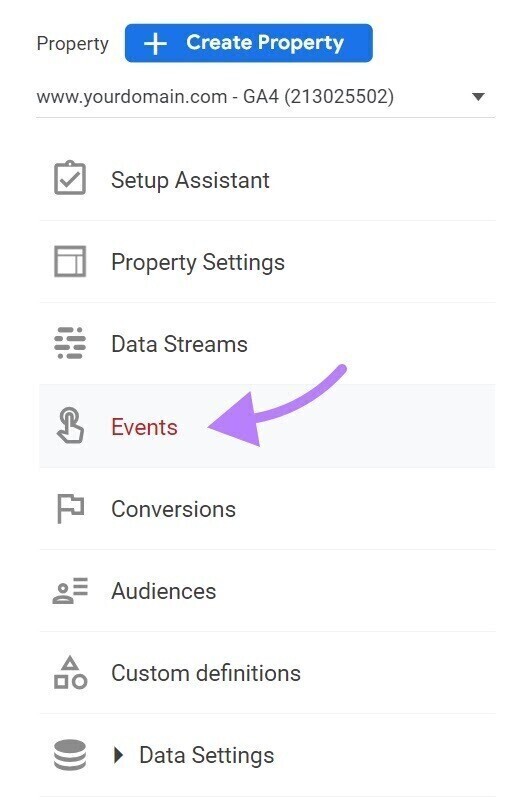
The "Events" button is highlighted in the property settings. Now you will see a list of all the events that have been tracked in Google Analytics.
Scroll down to find the file_download event. Use the toggle on the right side of the screen to "Mark as conversion" marking the file_download event as conversion.
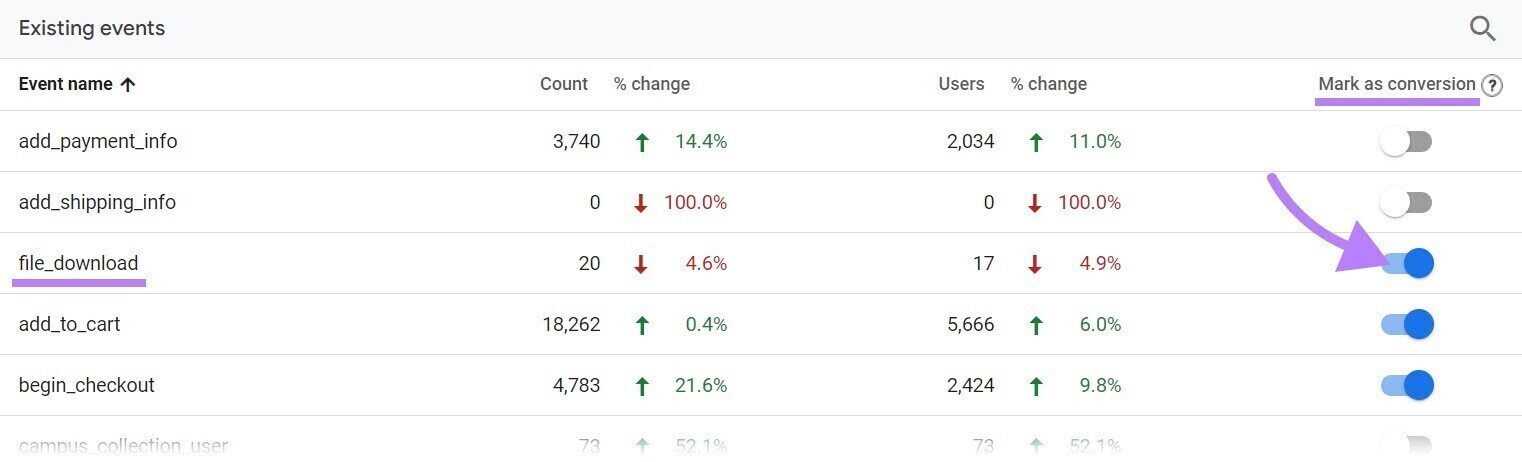
You've now created a conversion.
Note: You can still get value from Google Analytics if you don't set up conversions. Although it does help when it comes to evaluating your site content and traffic channels.
-
How to Use Google Analytics
Now that you have the basics down, it's time to go in and use Google Analytics. -
Google Analytics Tutorials
You have learned so much about Google Analytics now, and there's more to come—tutorials that will further speed up your learning.
You can start with these Google tutorials.
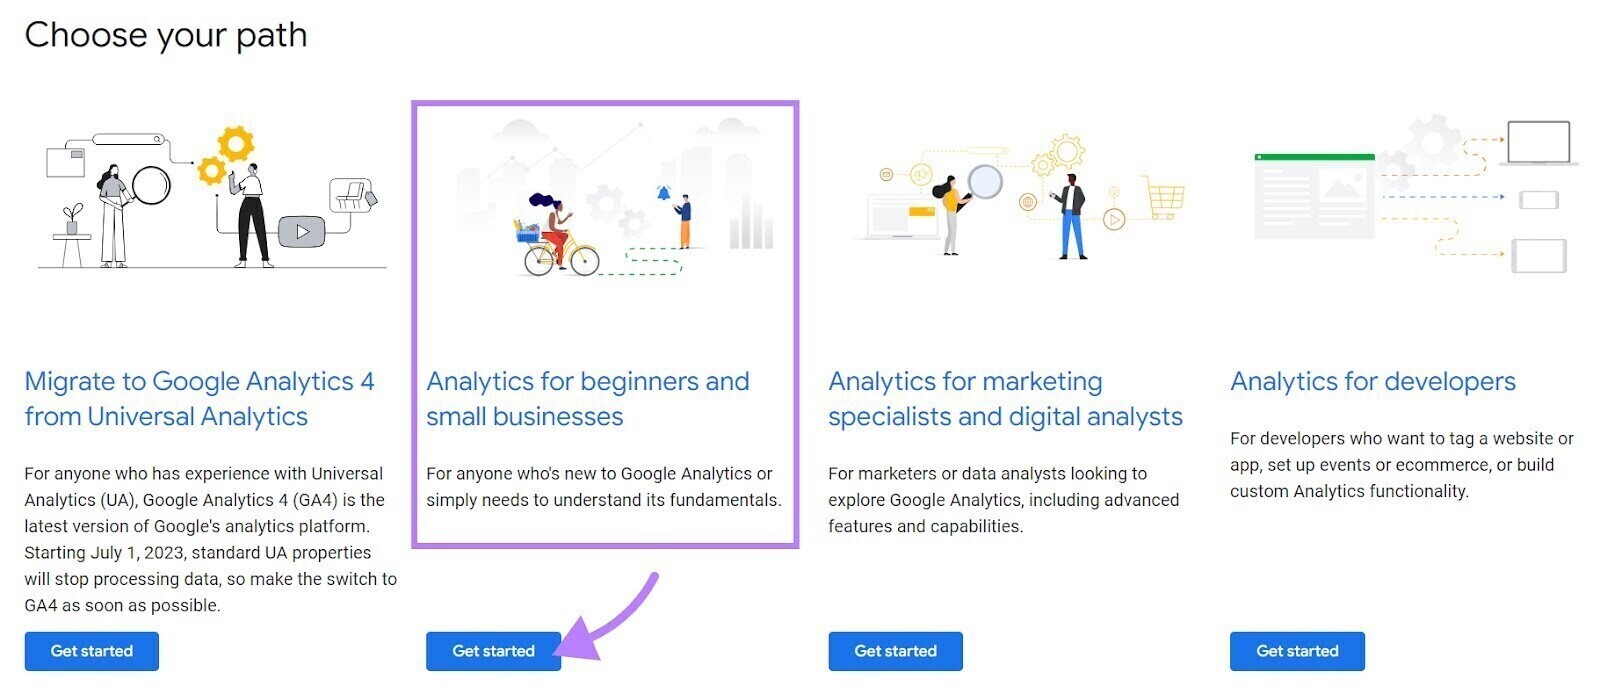
Here, you can choose your path. The "Analytics for beginners and small businesses" path is useful for those starting.
Click on "Get started" below that section.
From here, you'll be able to choose a specific training.
If you have been following along, you would already have set up a property.
Reviewing Part Two, "Finding Your Way Around Analytics," seems to be a pretty safe bet.
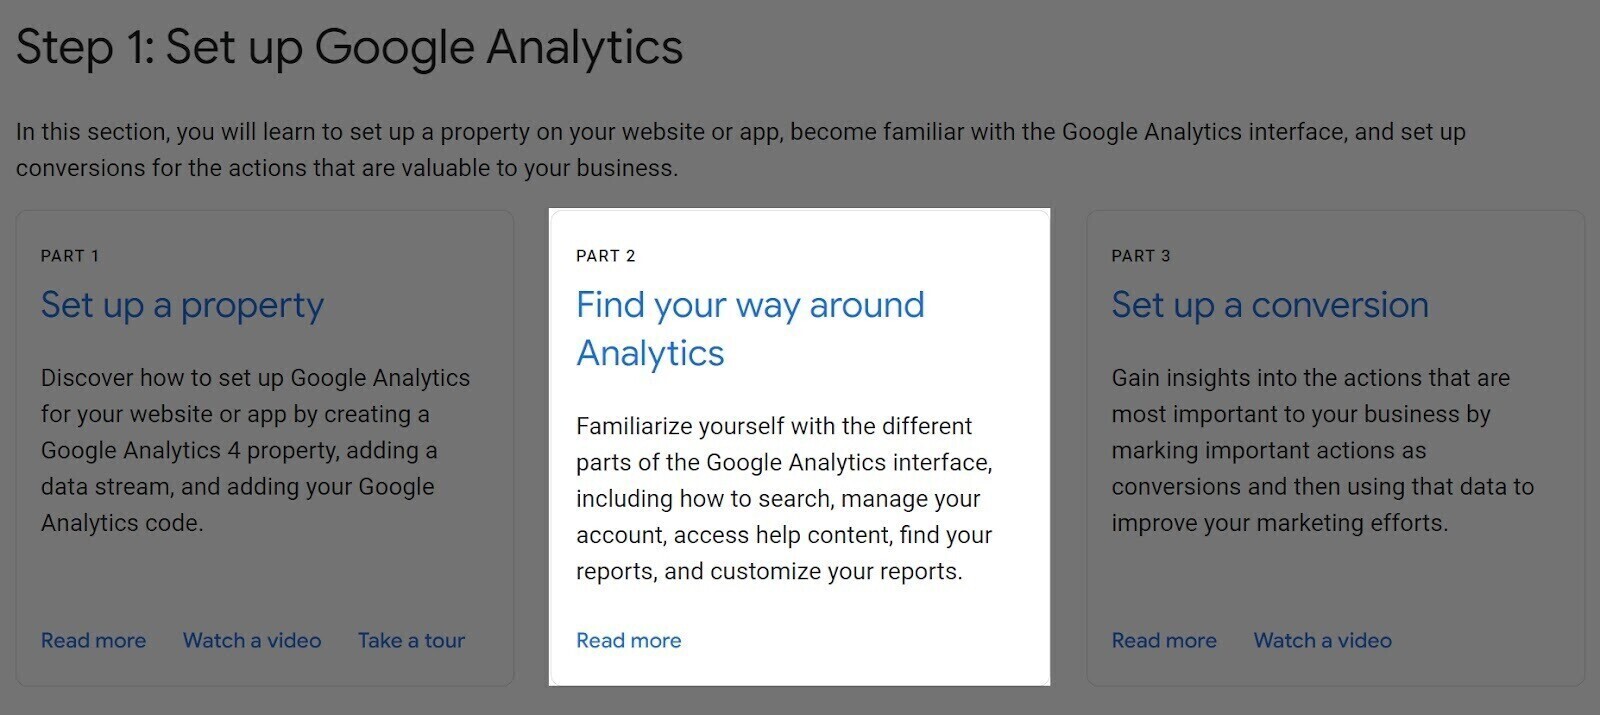
Here you'll learn how to personalize your reports, which is a useful next step.
You can even test your knowledge with the certification track in Google's Skillshop. Just use the search bar at the top of the page and type "Google Analytics Certification."
But the certification is optional. Many Google Analytics beginners get more long-term value from the platform by using it regularly to analyze user behavior and traffic performance. Comparing your performance with that of the competitors will further magnify your analytical insights.